
M. Suhail
Shares of Charter Communications (NASDAQ:CHTR) have been a poor performer over the past year, losing 7%. However, Friday was a much-needed jolt with shares surging 16% after reporting solid Q2 earnings. Back in April, I upgraded shares of Charter to a “hold” from a “sell,” having fallen 31% since that sell recommendation. While I was right to upgrade shares, the “hold” has proven too cautious after their post-earnings rally. With shares up 37% and new financials, now is a good time to revisit Charter. I am encouraged by cash flow trends, but this improvement is reflected in the recent rally, resulting in me maintaining a hold rating.
Seeking Alpha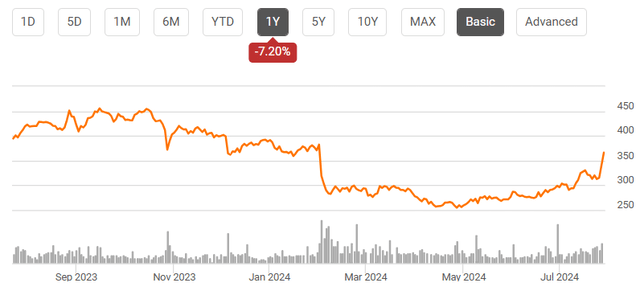
In the company’s second quarter, Charter earned $8.49, beating consensus by $0.59 as revenue rose by 0.3% to $13.7 billion. Overall, the company continues to see similar operating trends as in recent quarters, namely consumers cutting the cord for video service while its smaller mobile unit sees dramatic growth. However, its lower cap-ex guidance was the major highlight. Capital spending and lower free cash flow have been my primary source of concern, and this quarter went a significant way to addressing it. Because of lower cap-ex, I now expect about $2.5 billion of 2024 free cash flow.
Looking at business results, residential revenue fell by 0.6% to $10.8 billion while commercial rose by 2.1% to $1.8 billion and advertising jumped 3.3% thanks to political spending. Charter’s local news channels benefit from higher political spending during Presidential Election years, which also see many House and Senate races. In fact, political spending boosted ad revenue by 5.5%. Otherwise, ad spending was down about 2%, consistent with the tighter budgets from national accounts that we have heard about from many ad-selling companies.
Charter continues to face headwinds from customers cutting the cord, a pressure it is trying to offset with price increase and tight cost discipline. Indeed, residential relationships fell by 1.3% to 29.6 million. Partially offsetting this, residential revenue per customer rose by 0.4% to $120.77. The commercial side has proven to be more resilient, with small and medium size business (“SMB”) relationships growing by 0.2% to 2.2 million thanks to growth in internet and mobile.
As you can see below, its consumer business continues to face sustained customer attrition. In its three core products, losses were worse than last year with video essentially doubling to nearly 400k lost customers. In theory, internet should prove to be more resilient as you need internet access to stream Netflix (NFLX) and other streaming services. However, even here, results were disappointing.
Charter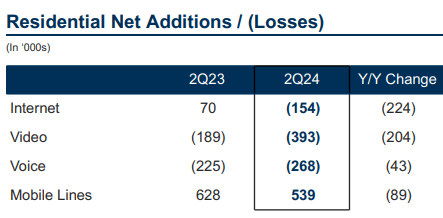
One challenge for the company has been that the housing market has been quite subdued. When consumers move, that is a key opportunity to win a new customer, but with home sales so muted, that avenue of growth is limited. While mobile growth slowed, its customer count is up 33% from last year. Mobile revenue was up 37%. This was a significant inflection point. CHTR has aggressively added mobile customers through outsized promotions, which have meant customer growth exceeded revenue growth. Now as promotions roll off, we are seeing mobile revenues flex higher. In that context, I am comfortable with slower line growth.
That said, it is important to reiterate mobile is still a small piece of the business. In consumer, internet revenue rose by 1.3% to $5.8 billion, while video fell by 7.7% to $3.9 billion. Mobile revenue rose by 37%, but that is less than $200 million of benefit, essentially just offsetting the lost video revenue. Now, because it has fewer customers, video programming costs fell by 9.8% to $268 million. Thanks to price increase, video revenue is outperforming programming costs by 210bps. This is a business clearly in decline, but Charter is managing through it.
42.9% of customers are non-video, up 4% from last year. As a result, three or more product penetration fell by 170bps to 19.2%, leading to a 20bp rise in 2 product penetration and further rise in 1 product penetration. Still, adjusted EBITDA of $5.7 billion was up 2.6% from last year as margins expanded by 100bps to 41.4%.
There are several items going on here. First because of high programming costs, video can be a lower margin business, so the mix shift away from video is boosting margins. Additionally, price increases are, for now, offsetting customer losses. Finally, it is managing expenses fairly well. Service costs fell by $88 million due to lower labor and bad debt expense. Sales and marketing rose by a fairly modest 1.9%, or $17 million. This is a business with minimal, if any, underlying growth, given secular shifts in consumer tastes, but it is managing this decline reasonably.
I was more encouraged by revised capital plans. Given its lackluster growth prospects, its cap-ex budget seemed too large, weighing on potential free cash flow and limiting potential buybacks In Q2, Charter did $2.9 billion of cap-ex. There was a $37 million increase in line-extension spending in subsidized rural construction; otherwise, cap-ex was down $18 million from last year. Q2 spending was modestly below expectations.
Charter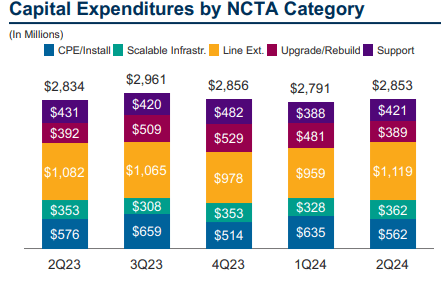
Even more importantly, full year capital spending is now forecast to be around $12 billion, down $300 million from its prior estimate, though it still implies a ramp during H2 relative to H1. Given the weak customer net-addition environment, management has been able to reduce capital plans. This is a clear positive, as the return on that spending was dubious in my view, given the secular headwinds Charter faces. Cap-ex should be peaking over the next twelve months and then gradually migrate down toward $11 billion in 2026, or perhaps lower now.
That is critical because CHTR needs free cash flow to manage its debt and return capital to shareholders. In the second quarter, CHTR generated $1.3 billion in free cash flow, which included $471 million of working capital benefits. For the year, it now sees working capital being a slight tailwind. With this free cash flow, we saw a moderate amount of share repurchases, about $400 million. Thanks to its buyback program, there has been 4.6% share count reduction over the past year.
Equally important, CHTR did $370 million of debt reduction in the quarter. Still given refinancing, interest expense rose by $30 million to $1.33 billion. The company has 4.3x debt/EBITDA, the midpoint of its 4-4.5x target. It has $96.5 billion of debt with limited near-term maturities. As such, interest rate risk should be manageable.
Charter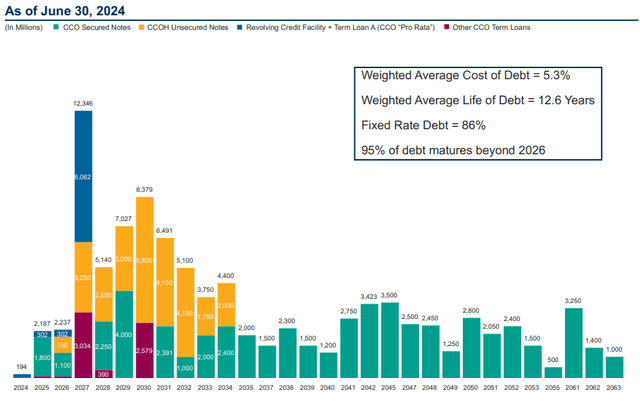
Pro forma for share-based compensation, I now expect Charter to generate $2.4-$2.6 billion of free cash flow this year with 2025 free cash flow likely to be similar. That is about $18/share. That gives shares about a 4.9% free cash flow yield, which will enable significant share-count reduction. By 2026, I would expect closer to $3.4 billion in free cash flow, or about $24 a share.
Ultimately, I view fair value as a ~6% long-term free cash flow yield, as customer growth of about 0% and price growth of about 2% supports ~2% organic cash flow growth, which combined with a 6% starting yield should enable 8% returns. With my 2026 free cash flow estimate, I see shares reaching $400 by the end of 2025, about a 9% return over the next 12-16 months.
I view this as consistent with a “hold” rating as shares have upside but less than my 10% annual return target for a “buy” rating. After Friday’s rally, Charter appears to be pricing in much of the improved news. As such, I remain a hold. If we see shares move closer to $400, I would be inclined to take profits. Similarly, if shares were to pull back to about $350, I would be a buyer.
Credit: Source link