

Global_Pics/iStock Unreleased via Getty Images
Investment thesis
Shoe Carnival, Inc. (NASDAQ:SCVL) is turning around its fortunes, with Q1 of fiscal 2024 perhaps being the pivotal point. But investors have been expecting that sort of news for some time:
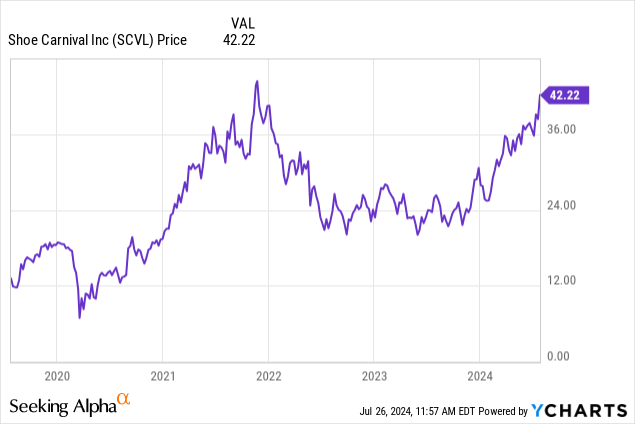
Investors have had the right idea, with Shoe Carnival launching several initiatives to grow the business and constrain costs.
Based on these initiatives and the speed with which prices have been bid up in the past year, I expect the company’s earnings to grow 6% this year and have rated it a Buy.
About Shoe Carnival
The firm has been in business for 45 years, and has grown into a chain of 430 company-operated stores, as well as an ecommerce merchant.
It sells national name brand shoes through two retail chains, Shoe Carnival and Shoe Station, according to its 10-K for fiscal 2023. The latter was acquired in late 2021, and grew by 28 stores in February when it acquired Rogan Shoes.
In its physical stores, it differentiates itself by providing customers with competitive prices and an interactive experience. The latter involves upbeat music, spin-n-win wheels, and a person on a microphone who runs special promotions, including contests, games, and announces special in-store deals.
At the end of fiscal 2023, which ended on the last Saturday before January 31, it operated 372 Shoe Carnival stores across 35 states and 28 Shoe Station stores. According to its 10-K, the latter brand serves a broader base of family footwear customers. With the acquisition of Rogan in Q1, it boosted its count to 56.
The company reports that it sells a diversified mix of shoe products to different demographic groups. At the same time, a few brands account for a material amounts of sales. In fiscal 2023, Nike, Inc. (NKE), Skechers U.S.A., Inc., and Crocs, Inc. (CROX) collectively accounted for about 45% of net sales.
At the close on July 25, 2024, its shares traded at $41.60 and it had a market cap of $1.11 billion.
Competition and competitive advantages
Shoe Carnival calls the retail footwear business highly competitive, which is no surprise since barriers to entry are relatively low. Of course, that’s something we know from our own observations. Shopping malls are well populated with shoe stores, big box firms like Walmart Inc. (WMT) and Costco Wholesale Corporation (COST), and then there are many specialty or neighborhood stores, and more.
It reported in the 10-K that it believes the main competitive factors to be merchandise selection, price, fashion, quality, location, shopping environment and service.
Looking at competitive advantages, management wrote in the 10-K, “We believe our distinctive shopping experience gives us important competitive advantages, including the building of a loyal, repeat customer base, the creation of word-of-mouth advertising, and enhanced sell-through of in-season goods.”
In other words, the upbeat music, spin-n-win wheels, and the rest create an atmosphere that helps create a buying atmosphere and differentiates it. This will be more attractive to younger rather than older consumers, but younger shoppers replace their shoes more often.
The margins provide a modest amount of support for its competitive advantages:
- Gross margin: 35.97% versus 36.64% for the Consumer Discretionary sector median.
- EBIT margin: 8.06% versus 7.81%.
- Net income margin: 6.20% versus 4.89%.
The latter two are slightly above the industry medians, and the first is slightly below. But we get a more striking comparison when we scan the margins posted by Deckers Outdoor Corporation (DECK), a premium footwear, apparel, and accessories retailer (the home of UGGs and HOKA, among others):
- Gross margin: 55.63%
- EBIT margin: 21.85%
- Net margin: 17.71%.
Obviously, Deckers is squeezing more profits out of its revenue than Shoe Carnival. And to put a finer point on it, Deckers has a return on equity of 39.22%, while Shoe Carnival has an ROE of 13.05%.
Shoe Carnival may have a moat, but I expect it would be a narrow one.
Recent financial results
President and Chief Executive Officer Mark Worden sounded positive notes as he summarized the company’s first quarter 2024 release (which ended on May 4). Results were released on May 23, and he said net sales growth was ahead of expectations, gross margin increased versus Q1 last year, and earnings were at the high end of their expectations.
He added, “We gained significant market share, with accelerating sales momentum across our business as the quarter progressed, including double-digit growth in sandals that continued in the quarter after the Easter holiday period.”
This is selected data from the income statement:
SCVL income statement data (author)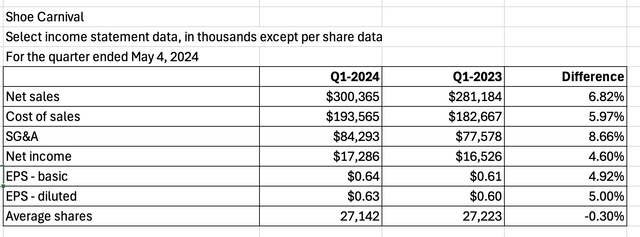
These are the kinds of numbers you like to see on an income statement: across the board increases from the top to bottom line, and a reduction in the number of shares outstanding. Note that the first fiscal quarter of 2023 ended on April 29, but both quarters covered 13 weeks.
Similarly, the balance sheet shows double-digit increases, except for total liabilities, and that’s good:
SCVL balance sheet data (author)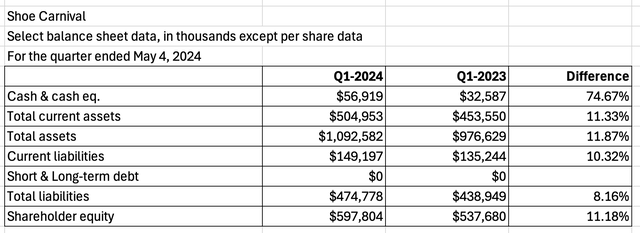
From the cash flow statement, select data show Shoe Carnival significantly improved its cash and cash equivalents this year over last year:
SCVL cash flow statement data (author)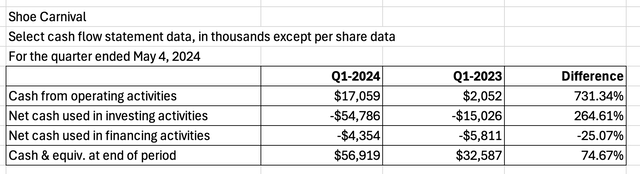
Comments: I’m most impressed by the lack of debt, both short and long-term. As we saw above, it has made two major acquisitions in the past five years without borrowing.
These financial results suggest the company is doing a good job at growing its revenue while keeping costs contained, or at least proportional to growth.
Overall, the firm is well managed and now growing profitably.
Shoe Carnival Growth
The Q1 results tell a different tale than the results between the first quarter of 2022 and the fourth quarter of 2023:
SCVL revenue, EBITDA, net income chart (Seeking Alpha )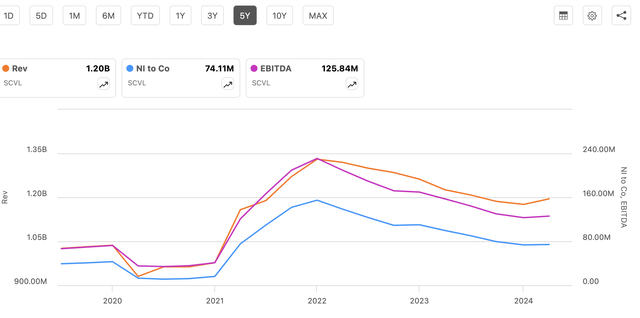
The chart shows how all three metrics were pulled down by the COVID-19 pandemic that took hold in the first quarter of 2020. After a recovery, all three of these key metrics slid back. Why?
In the Q4-2022 earnings call (March 22. 2023), Worden noted, “If you recall, last year [2022], we had some significant supply challenges and disruptions to our athletic business in our most important part of the year.”
And in the Q4-2023 earnings call (March 21, 2024), he said, “2023 was a challenging year overall with net sales declining versus the prior year. Customers were cautious during the year, focused on event-driven shopping occasions and the central footwear purchases.”
Going forward, the company plans to expand its store count to over 500 in 2028. That’s an increase of 17.5%. Dividing that 17.5% by five years works out to 3.50% per year, which is in line with the growth rates we saw in the income statement.
It is also in the midst of an inventory optimization plan; in fiscal 2024 it expects to reduce inventory by $20 million or 5% versus fiscal 2023. That will produce growth on the bottom line independent of revenue.
Shoe Carnival also has been modernizing its stores; as of May 4, it had completed over 60% and will continue in fiscal 2024. Modernized stores normally generate more revenue than those that are left unchanged.
And, the company now sees acquisitions as a way to generate new growth, an idea that is workable for a company with cash on hand and no debt.
Comments: I see accelerating growth ahead as it gets out of the previous slump and focuses on cost containment and expansion. I would not be surprised to see it hit 500 stores before 2028.
A growing dividend
This chart shows Shoe Carnival’s dividend history over the past five years:
SCVL dividend history chart (Seeking Alpha )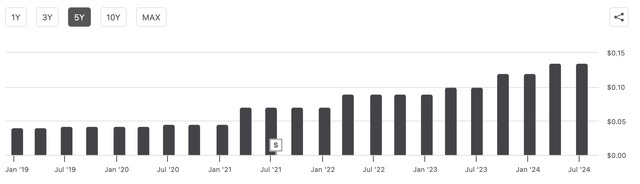
It has had 11 consecutive years of dividend growth.
The yield is a modest 1.32%, and the payout ratio is low at 17.34%. Since the company is eyeing more growth, I do not expect any significant increase in the yield for at least a few years.
No shares were repurchased in Q1-2024, however, the company has authorized up to $50 million in buybacks. I see little appetite for buybacks as long as the share price keeps rising.
Fair valuation
Over the past year, Shoe Carnival’s share price has jumped by 66.87% and over five years is up 210.27%.
With the share price rising quickly and earnings growing slowly, it’s understandable that the Seeking Alpha system gives it a D+ valuation grade. Still, it has a P/E Non-GAAP [TTM] of 14.89, only slightly higher than the Consumer Discretionary median of 14.42. The P/E Non-GAAP [FWD] ratio is 15.13, and essentially the same as the median of 15.18.
The EV/EBITDA [TTM] ratio is 11.19, slightly higher than the median of 10.73. On a forward basis, it is 10.79 versus 9.65.
Price/Sales [TTM] is below 1.00 at 0.93, which is comparable to the median of 0.91.
So, overall, I think the poor valuation grade is too severe, and that Shoe Carnival is close to a fair price.
At the same time, it has two Up revisions and zero Down revisions. It also has an A+ grade for momentum as a result of its rising share price. On the technical side, the 10-day and 50-day simple moving averages are above the 200-day, indicating the price may keep rising.
As for earnings, Shoe Carnival reiterated its forecast of GAAP EPS in a range of $2.50 to $2.70 and Adjusted EPS in a range of $2.55 to $2.75. Wall Street analysts have a mixed view:
SCVL EPS estimates table (Seeking Alpha )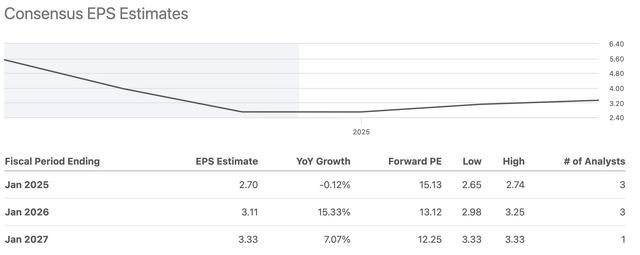
As noted, the store count is expected to grow an average of 3.5% per year through 2028, plus I expect to see lower costs through inventory reduction, more buying interest as consumer caution wanes, gains from store modernizations, and the benefits of greater scale. All of this leads me to believe Shoe Carnival has turned a corner and its rebound will continue for at least another year.
Summing up the 3.5% and estimates for intangibles, I expect growth of 6.0% in this fiscal year and next. Adding 6% to the bottom figure, $2.50, provides a low earnings estimate of $2.65. Adding 6% to the top figure of $2.75 provides a high estimate of $2.92.
Plugging that 6% the intrinsic value calculator at OmniCalculator produces an output of $47.83 and a 13.02% margin of safety.
SCVL intrinsic value calculator (omnicalculator)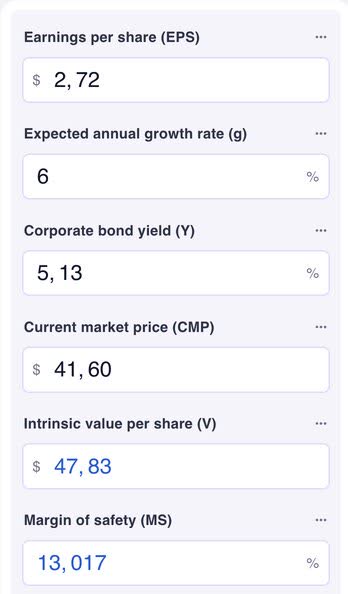
The Moody’s Seasoned Aaa Corporate Bond Yield was 5.13% on July 25.
Comments: I believe Shoe Carnival is fairly valued and have set a one-year price target of $47.83. I also rate it a Buy. No other Seeking Alpha analysts have provided a rating in the past 90 days, while the Quant system rates it a Hold. Wall Street analysts provide two Strong Buys and one Hold, for an overall rating of Buy.
Above, I favorably compared Deckers’ margins and returns with those of Shoe Carnival. Any investor looking for a footwear company should have a look at it as well. However, be prepared to pay more for Deckers; it has a valuation grade of D-, made up of a P/E Non-GAAP [TTM] OF 28.88 and a P/E Non-GAAP [FWD] of 27.17, and more. Both ratios are almost double those of Shoe Carnival.
Risk factors
Let’s start with consumer sentiment, something that can be volatile and can be brought down by a thousand causes, everything from war to an uptick in inflation. When consumer sentiment goes down, consumer discretionary companies will be the among the first to be affected.
Competition is intense, with everything from corner stores to online giants offering footwear in their physical and digital aisles. That means trouble if management fails to monitor and respond to ever changing styles, prices, and locations.
Shoe Carnival relies on imported goods, and in the words of the 10-K, “Substantially all of our footwear product is manufactured overseas, including the merchandise we purchase from domestic vendors and the smaller portion we import directly from overseas manufacturers. Our primary footwear manufacturers are located in China.” Changes in trade rules or regulations could have serious effects.
Much of the retail industry was hard hit by the COVID-19 pandemic, a condition that hasn’t yet, and may never, go away. It’s quite possible it or currently unknown public health contagions may have devastating effects again.
In the 10-K, the company pointed out it will need “significant funds” to execute its business strategy. It has had no debt in the past 19 years, and assuming it now could seriously increase its expenses. Alternatively, it would mean issuing new shares and diluting the value of existing shareholders.
Conclusion
Investors’ faith in Shoe Carnival is being rewarded now. Its revenues, EBITDA, and net income are rebounding, as a turnaround takes shape. The company’s initiatives to grow its physical and online business are having an effect and should continue to yield better top and bottom line results.
I believe the share price will rise another 6% in the next year, to $47.83, and have given it a Buy rating.
Credit: Source link