
Aslan Alphan
SMH ETF is now priced at 45x P/E
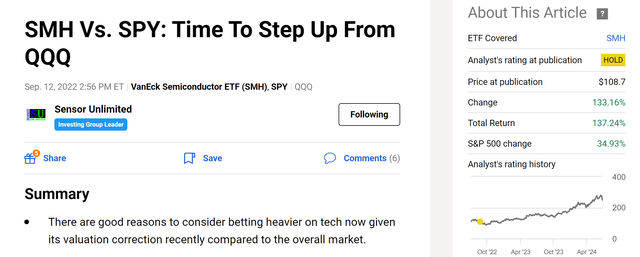
I last wrote on the VanEck Semiconductor ETF (NASDAQ:SMH) in September 2022 (see the screenshot below). That article was titled Time To Step Up From QQQ. It was a while back, so I thought a little refresh of the overall background would be helpful. SMH has historically been traded at a higher P/E compared to the overall market or the tech sector represented by SPY and QQQ, respectively, due to its focus on high-growth stocks (more on this in the second section). However, the fund suffered large price corrections in late 2022 amid the global logistic network disruptions. The correction has brought SMH valuation to a discount relative to SPY and QQQ. Quote:
To wit, SMH suffered a total loss of almost 30% YTD. Recent corrections have brought SMH’s P/E to the current level of 17.5x, about a 14% discount from SPY’s 20.2x. To add another reference point, the NASDAQ 100 index, represented by the Invesco QQQ ETF (QQQ), suffered a total loss of 22%. Combined with earnings changes, the P/E of SMH now stands at an even larger discount from QQQ (about 25.0x) by a discount of ~30%.
Seeking Alpha
Therefore, my previous article urged investors (many of which I assumed to have sizable positions in either SPY or QQQ) to consider a more concentrated bet on the tech stocks held in SMH. Indeed, SMH has delivered terrific returns since then. Its price at my last publication was $108. Compared to the price of this writing, the total return from SMH is over 137%, outperforming SPY by more than 100%.
A working thesis tends to defeat itself eventually. As prices advance, valuation expands and risks heighten. In the remainder of this article, you will see why this is exactly what has happened to SMH over the past ~2 years or so. The valuation discount 2 years ago has now been replaced by a huge valuation premium with a P/E of around 45x. To make things worse, the premium is disconnected from SMH’s profitability metrics in my view given the recent enthusiasm in AI-related stocks.
SMH ETF: AI-fueled optimism is overdone
QQQ is widely known for its tech-oriented exposure. Despite the reputation, QQQ actually has substantial exposure to non-tech stocks as well. In contrast, SMH is a truly pure play on technology stocks as stated in the following fund description:
VanEck Semiconductor ETF seeks to replicate as closely as possible, before fees and expenses, the price and yield performance of the MVISUS Listed Semiconductor 25 Index (MVSMHTR), which is intended to track the overall performance of companies involved in semiconductor production and equipment.
As you can see from the chart below, SMH allocates a significantly higher percentage of its holdings to the Electronic Technology Sector (86.28%) compared to QQQ (33.6%). While QQQ has substantial holdings of non-tech companies such as retail trade (10.15%) and healthcare (6.3%).
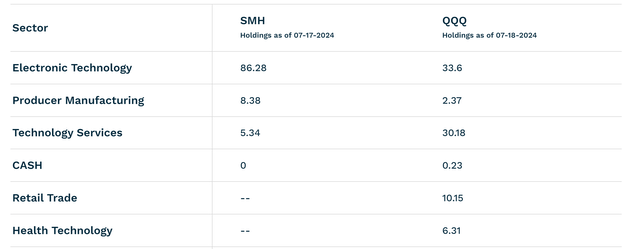
Source: ETF.com
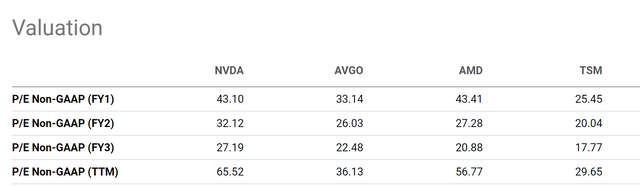
Given its concentrated bet on tech stocks, especially those involved with semiconductors and chips, a large driver for SMH’s outsized return since my last writing is the rise of AI technologies. To provide a more vivid impression of the role of AI-related stocks in this stock, the chart below shows the P/E ratios of its 4 largest holdings: Nvidia (NVDA), Broadcom (AVGO), Advanced Micro Devices (AMD), and Taiwan Semiconductor Manufacturing Company (TSM). As seen, all of them – with the possible exception of TSM – are currently trading at extremely high P/E ratios, both in absolute terms and relative terms. As seen, NVDA trades at a P/E ratio of 65.52 (on a Non-GAAP and TTM basis), AMD at 46.77, and AVGO at 36.13x, all far above the broader market either represented by the S&P 500 or the Nasdaq 100 Index.
To make things even more concerning, SMH’s current high valuation is disconnected from the profitability of the underlying holdings, as detailed next.
Seeking Alpha
SMH ETF: P/E premium disconnected from profitability
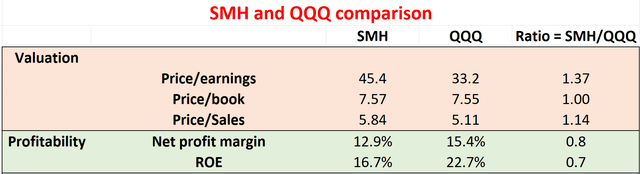
The next table compares the valuation multiples and profitability metrics of SMH to those of QQQ. The data used in the table were gleaned from ETF.com and MarketChameleon on July 21. Given the ongoing market volatility, these numbers may have changed a bit when you read the article. But I think the overall picture should remain the same. As aforementioned, SMH’s valuation discount relative to QQQ at my last writing is now replaced by an alarming valuation premium. To wit, SMH’s current P/E ratio stands at 45.4x as seen. Compared to QQQ’s P/E ratio of 33.2 (which is already among the highest levels in at least 10 years), SMH’s ratio represents a 37% premium.
Yet, SMH’s sizable valuation premium is not supported by the profitability metrics of its underlying holdings. The fundamental reason in my view is that the market’s enthusiasm for AI technologies is currently far ahead of the actual financials. For example, the average profit margin for SMH’s underlying holdings is 12.9% (inferred from the fund’s P/E and P/S ratios). This is lower than QQQ’s 15.4% margin by 20%. The average ROE for SMH’s underlying holdings is 16.7% (inferred from the fund’s P/E and P/B ratios). This is lower than QQQ’s 22.7% ROE by about 30%.
Author
Other risks and final thoughts
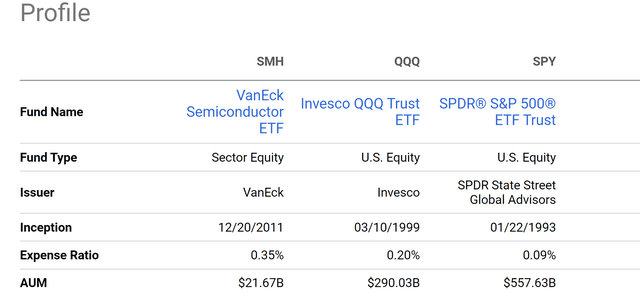
Besides the above valuation risks, SMH is also exposed to the same set of macroeconomic risks as other large-cap index ETFs such as QQQ and SPY. Therefore, here I will focus more on the risks that are more specific to the fund itself. SMH also charges a much higher fee than most passively indexed funds. As you can see from the next chart below, its expense ratio of 0.35% is almost double that of QQQ (0.20%) and quadruple that of SPY (0.09%). In addition, SMH, with an AUM that is orders of magnitude smaller than QQQ and SPY, also tends to suffer more trade friction, another issue you may need to consider depending on how actively you trade.
Seeking Alpha
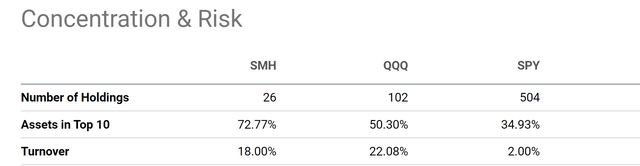
On the positive side, despite its fewer holdings (26 currently), SMH has a turnover rate of about 18%, actually lower than QQQ’s 22% turnover rates as seen. A lower turnover rate could lessen tax headwinds. Although over the broader scheme of passively index funds, an 18% turnover is quite high (e.g., SPY’s turnover is only ~2%). Another key upside risk involves the ongoing geopolitics. SMH suffered a sizable price correction off its peak levels, largely due to the market’s fear about export control and presidential candidate Donald Trump’s recent remarks regarding Taiwan. Things can change unexpectedly (and quickly, as reflected in the dramatic events in the past few days) over the election and the potential candidates have vastly different platforms on trade and tariffs. Such geopolitical developments can send favorable news for SMH and trigger a large price rebound considering SMH’s concentrated exposure to advanced chips, a focal point of the ongoing U.S.-China tension.
All told, my verdict is that the overall reward/risk profile is unfavorable. To recap, the dominant forces here are A) SMH’s oversized valuation premium and B) the disconnection of its valuation premium and profitability metrics. In my last writing, I recommended investors consider a more concentrated bet on the tech stocks by replacing their QQQ/SPY holding with SMH. Given the updated considerations in this article, I now urge SMH investors to cash out and better diversify their tech exposure with other market segments.
Seeking Alpha
Credit: Source link