
• bitcoinBitcoin(BTC)$84,172.00-2.53%
  • ethereumEthereum(ETH)$2,687.26-2.25%
  • tetherTether(USDT)$1.000.00%
  • binancecoinBNB(BNB)$774.01-2.02%
  • rippleXRP(XRP)$1.50-7.45%
  • usd-coinUSDC(USDC)$1.000.00%
  • solanaSolana(SOL)$114.96-3.27%
  • tronTRON(TRX)$0.343658-0.07%
  • zcashZcash(ZEC)$1,513.70-6.60%
  • Figure HelocFigure Heloc(FIGR_HELOC)$1.040.37%
  • HyperliquidHyperliquid(HYPE)$92.84-4.57%
  • dogecoinDogecoin(DOGE)$0.094377-7.30%
  • moneroMonero(XMR)$559.46-2.15%
  • whitebitWhiteBIT Coin(WBT)$84.55-2.56%
  • USDSUSDS(USDS)$1.000.00%
  • chainlinkChainlink(LINK)$12.40-4.83%
  • cardanoCardano(ADA)$0.240616-6.68%
  • RainRain(RAIN)$0.012188-6.63%
  • leo-tokenLEO Token(LEO)$8.990.17%
  • stellarStellar(XLM)$0.203047-7.77%
  • bitcoin-cashBitcoin Cash(BCH)$337.58-3.86%
  • uniswapUniswap(UNI)$9.21-12.19%
  • nearNEAR Protocol(NEAR)$4.27-5.64%
  • litecoinLitecoin(LTC)$68.036.06%
  • Ethena USDeEthena USDe(USDE)$1.00-0.01%
  • daiDai(DAI)$1.000.02%
  • avalanche-2Avalanche(AVAX)$10.22-8.36%
  • USD1USD1(USD1)$1.000.01%
  • CantonCanton(CC)$0.109414-3.46%
  • the-open-networkGram (prev. Toncoin)(GRAM)$1.42-2.61%
  • hedera-hashgraphHedera(HBAR)$0.091149-7.99%
  • suiSui(SUI)$0.96-6.26%
  • shiba-inuShiba Inu(SHIB)$0.000006-7.09%
  • BittensorBittensor(TAO)$288.65-8.06%
  • Global DollarGlobal Dollar(USDG)$1.00-0.01%
  • crypto-com-chainCronos(CRO)$0.062536-8.35%
  • MemeCoreMemeCore(M)$1.25-3.20%
  • BitwayBitway(BTW)$1.0312.44%
  • paypal-usdPayPal USD(PYUSD)$1.000.00%
  • tether-goldTether Gold(XAUT)$4,283.71-1.02%
  • okbOKB(OKB)$119.86-4.04%
  • Circle USYCCircle USYC(USYC)$1.140.01%
  • Ripple USDRipple USD(RLUSD)$1.000.00%
  • BlackRock USD Institutional Digital Liquidity FundBlackRock USD Institutional Digital Liquidity Fund(BUIDL)$1.000.00%
  • Ondo US Dollar YieldOndo US Dollar Yield(USDY)$1.14-0.21%
  • mantleMantle(MNT)$0.66-4.48%
  • aaveAave(AAVE)$139.41-7.96%
  • EthenaEthena(ENA)$0.207986-4.18%
  • OndoOndo(ONDO)$0.430374-1.77%
  • AsterAster(ASTER)$0.71-2.29%
TradePoint.io
  • Main
  • AI & Technology
  • Stock Charts
  • Market & News
  • Business
  • Finance Tips
  • Trade Tube
  • Blog
  • Shop
No Result
View All Result
TradePoint.io
No Result
View All Result

CB Leading Economic Index: Continued To Trend Down In June

July 20, 2024
in Market & News
Reading Time: 5 mins read
A A
CB Leading Economic Index: Continued To Trend Down In June
ShareShareShareShareShare

jmiks

YOU MAY ALSO LIKE

Forensic psychologist testifies Lindsay Clancy is ‘criminally responsible’ for children’s deaths

Current with Christine Romans – Aug. 25 | NBC News NOW

The latest Conference Board Leading Economic Index (LEI) decreased in June to its lowest level since April 2020. The index fell 0.2% from the previous month to 101.1, its smallest monthly decline in the past four months.

“The US LEI continued to trend down in June, but the contraction was smaller than in the past three months,” said Justyna Zabinska-La Monica, Senior Manager, Business Cycle Indicators, at The Conference Board. “The decline continued to be fueled by gloomy consumer expectations, weak new orders, negative interest rate spread, and an increased number of initial claims for unemployment. However, due to the smaller month-on-month rate of decline, the LEI’s long-term growth has become less negative, pointing to a slow recovery. Taken together, June’s data suggest that economic activity is likely to continue to lose momentum in the months ahead. We currently forecast that cooling consumer spending will push US GDP growth down to around 1 percent (annualized) in Q3 of this year.” More

Background on the Conference Board Leading Economic Index® (LEI)

The LEI is a composite index of several indicators. It is a predictive variable that anticipates, or leads, turning points in the business cycle and anticipates where the economy is heading. Since the LEI is comprised of multiple components, it is meant to provide a clearer picture as it is able to smooth out volatility associated with individual components. The ten components of Conference Board LEI include: Average weekly hours in manufacturing; Average weekly initial claims for unemployment insurance; Manufacturers’ new orders for consumer goods and materials; ISM® Index of New Orders; Manufacturers’ new orders for nondefense capital goods excluding aircraft orders; Building permits for new private housing units; S&P 500® Index of Stock Prices; Leading Credit Index™; Interest rate spread (10-year Treasury bonds less federal funds rate); Average consumer expectations for business conditions.
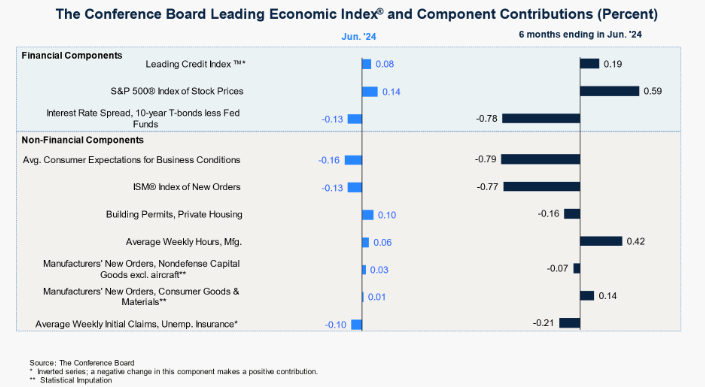
Conference Board's Leading Economic Index Components

Here is a chart of the LEI series with documented recessions as identified by the NBER. Note the peaks of the index preceding each of the recessions and the troughs occurring near the end of each recession.
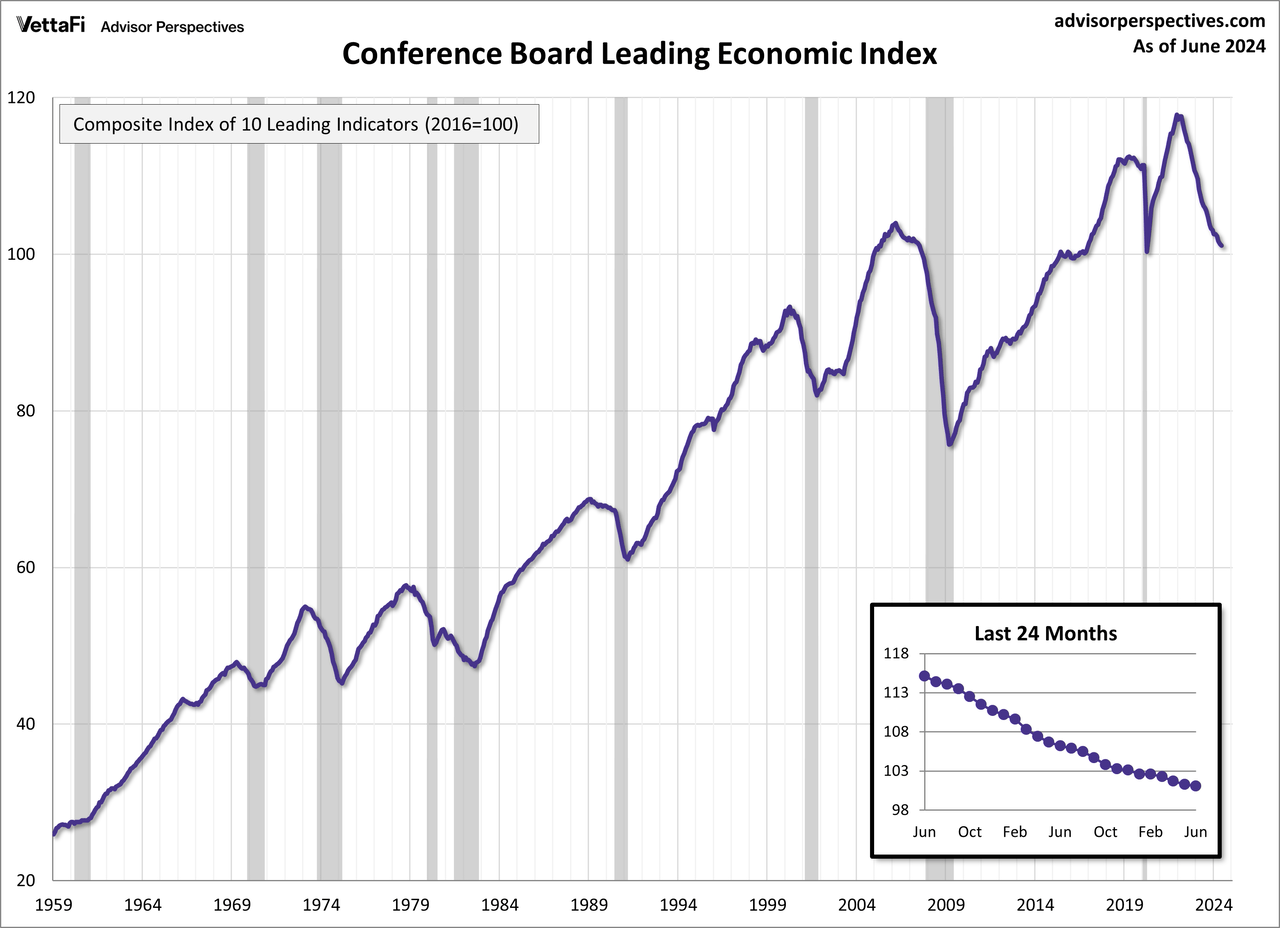
Conference Board's Leading Economic Index

Leading Economic Index and Recession Risk

For a better understanding of the relationship between the LEI and recessions, the next chart shows the percentage off the previous peak for the index. We are currently 14.2% off the 2021 peak. The chart also calls out the number of months between the previous peak and official recessions. On average, there is usually 10.6 months between a peak and a recession. We are currently 30 months off from the 2021 peak.
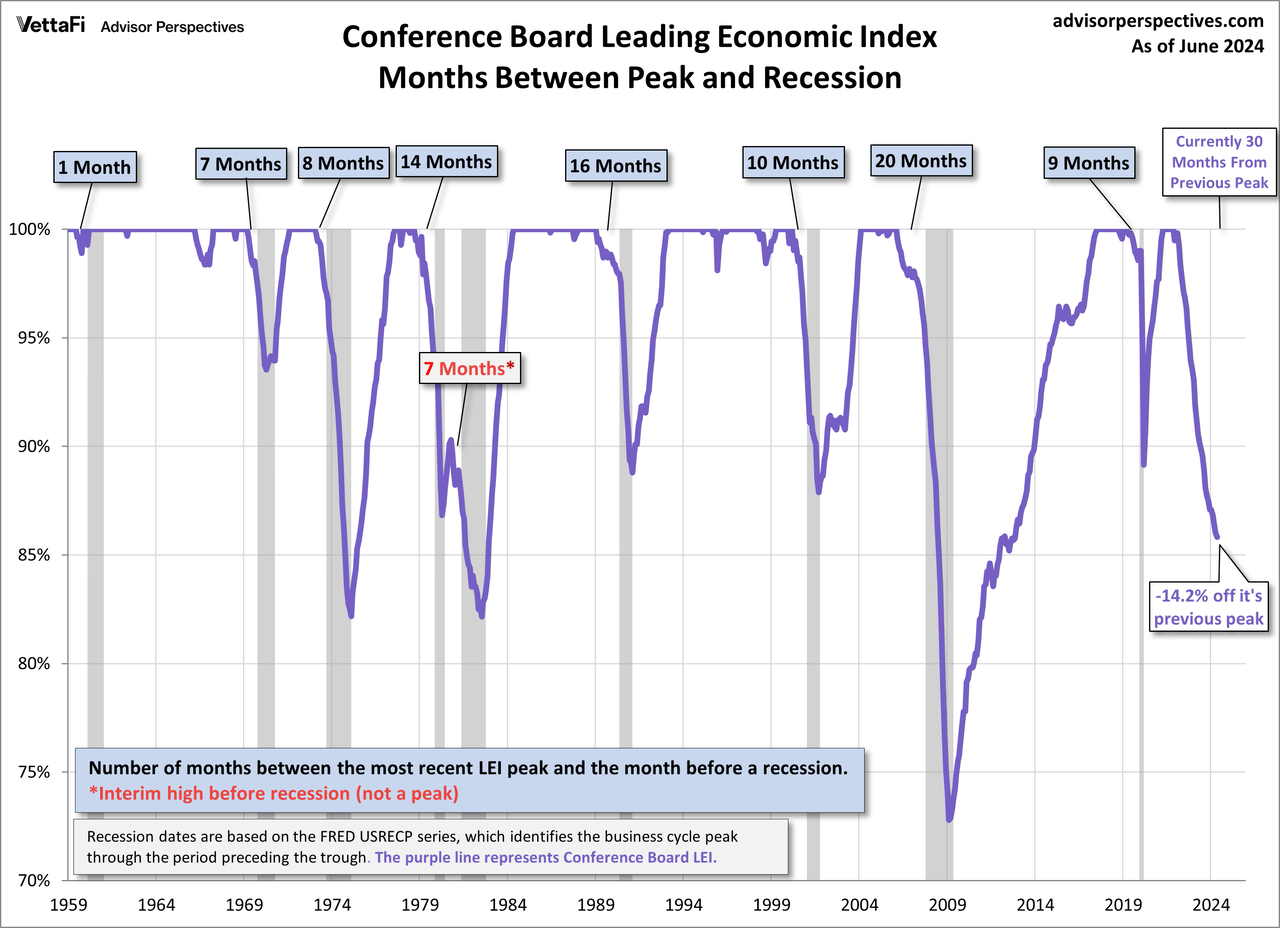
Leading Economic Index and Recessions

Leading Economic Index and Its 6-Month Smoothed Rate of Change

Based on suggestions from Neile Wolfe of Wells Fargo Advisors and Dwaine Van Vuuren of RecessionAlert, we can tighten the recession lead times for this indicator by plotting a smoothed six-month rate of change to further enhance our use of the Conference Board’s LEI as a gauge of recession risk.
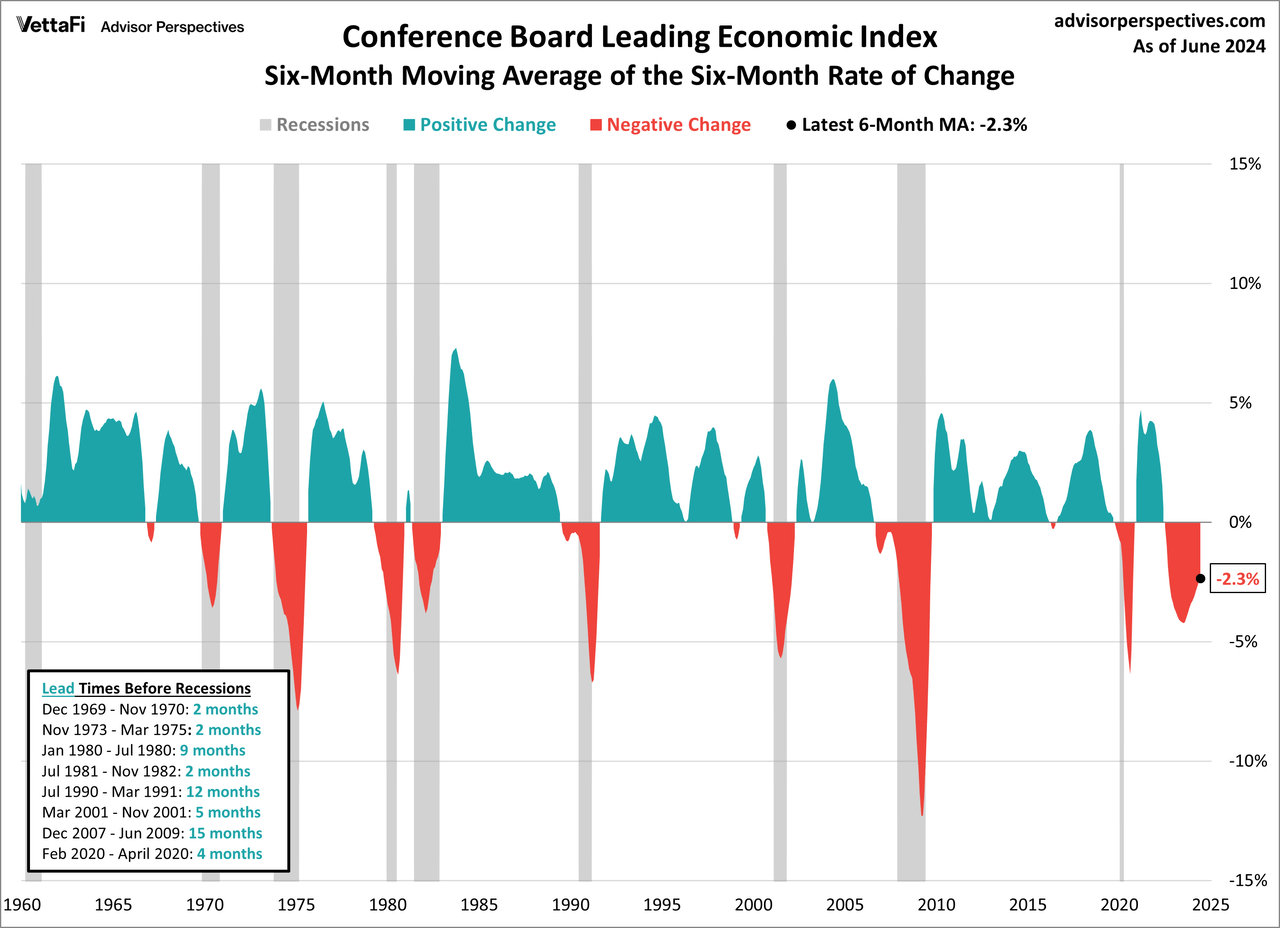
Leading Economic Index and Its 6-Month Smoothed Rate of Change

The LEI has historically dropped below its 6-month moving average (of 6-month ROC) anywhere between 2 and 15 months before a recession. Currently, the LEI has been below its 6-month moving average (of 6-month ROC) for 24 months. Note that there have been times where the LEI has been below the 6-month for multiple months without a recession.

Here is a 12-month smoothed out version, which further eliminates the whipsaws:
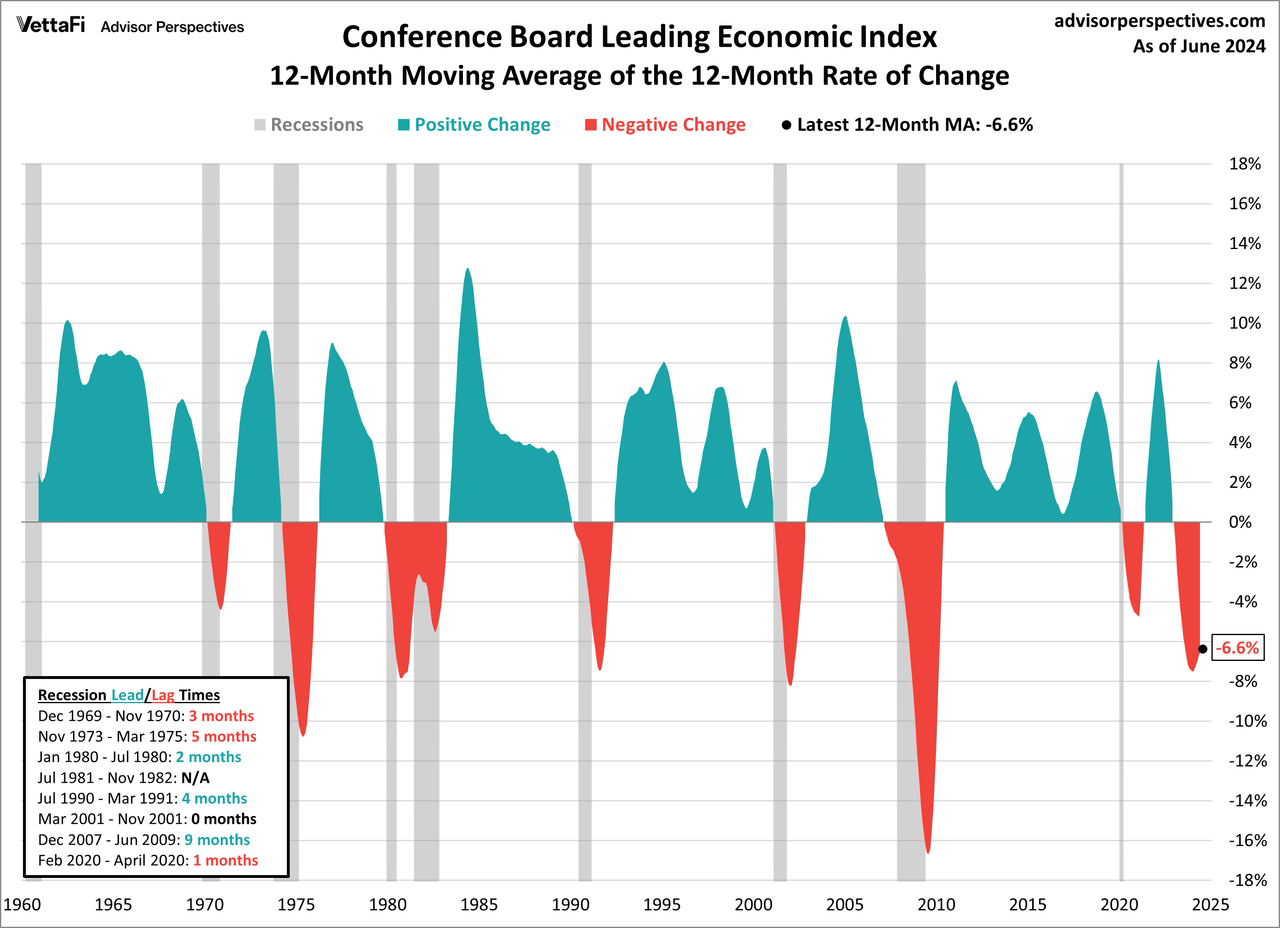
Leading Economic Index and Its 12-Month Smoothed Rate of Change

Currently, the 12-month moving average (of 12-month ROC) has been negative for 18 months.

Conference Board Coincident Economic Index®

The Conference Board also includes its coincident economic index (CEI) in each release. The CEI measures current economic activity and is made up of four components: nonagricultural payroll, personal income less transfer payments, manufacturing and trade sales, and industrial production.

The Conference Board Coincident Economic Index® (CEI) for the U.S. rose by 0.3 percent in June 2024 to 112.6 (2016=100), after increasing by 0.4 percent in May. The CEI grew 0.6 percent over the first half of 2024, about half its growth rate of 1.3 percent over the previous six months. The CEI’s component indicators-payroll employment, personal income less transfer payments, manufacturing and trade sales, and industrial production-are included among the data used to determine recessions in the US. All four components of the index improved in June, with industrial production making the largest positive contribution to the CEI for the second consecutive month.

Observations show that when the LEI starts declining, the CEI continues to rise. The LEI has declined or been flat each month since April 2022. Over that same time frame, the CEI experienced only 5 monthly declines. Here’s a chart including both the CEI and LEI.
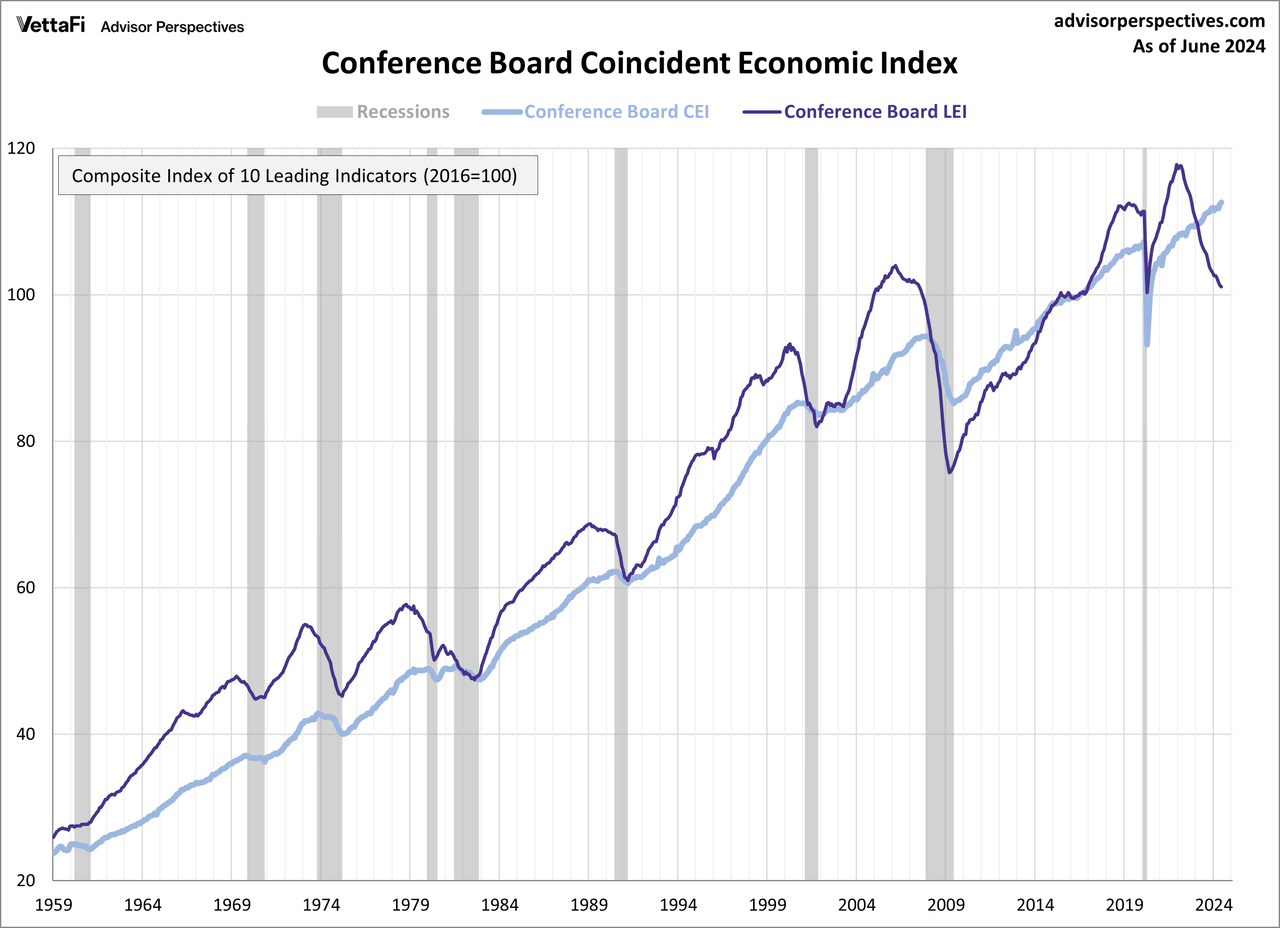
Conference Board Coincident Economic Index

Here is a chart of the LEI/CEI ratio, which perhaps has been a leading indicator of recessions. I count the lead time as the number of months that the ratio has been declining prior to a recession. The LEI/CEI ratio has now declined for 27 consecutive months. There have been times where the ratio has been in decline for several months without a recession.
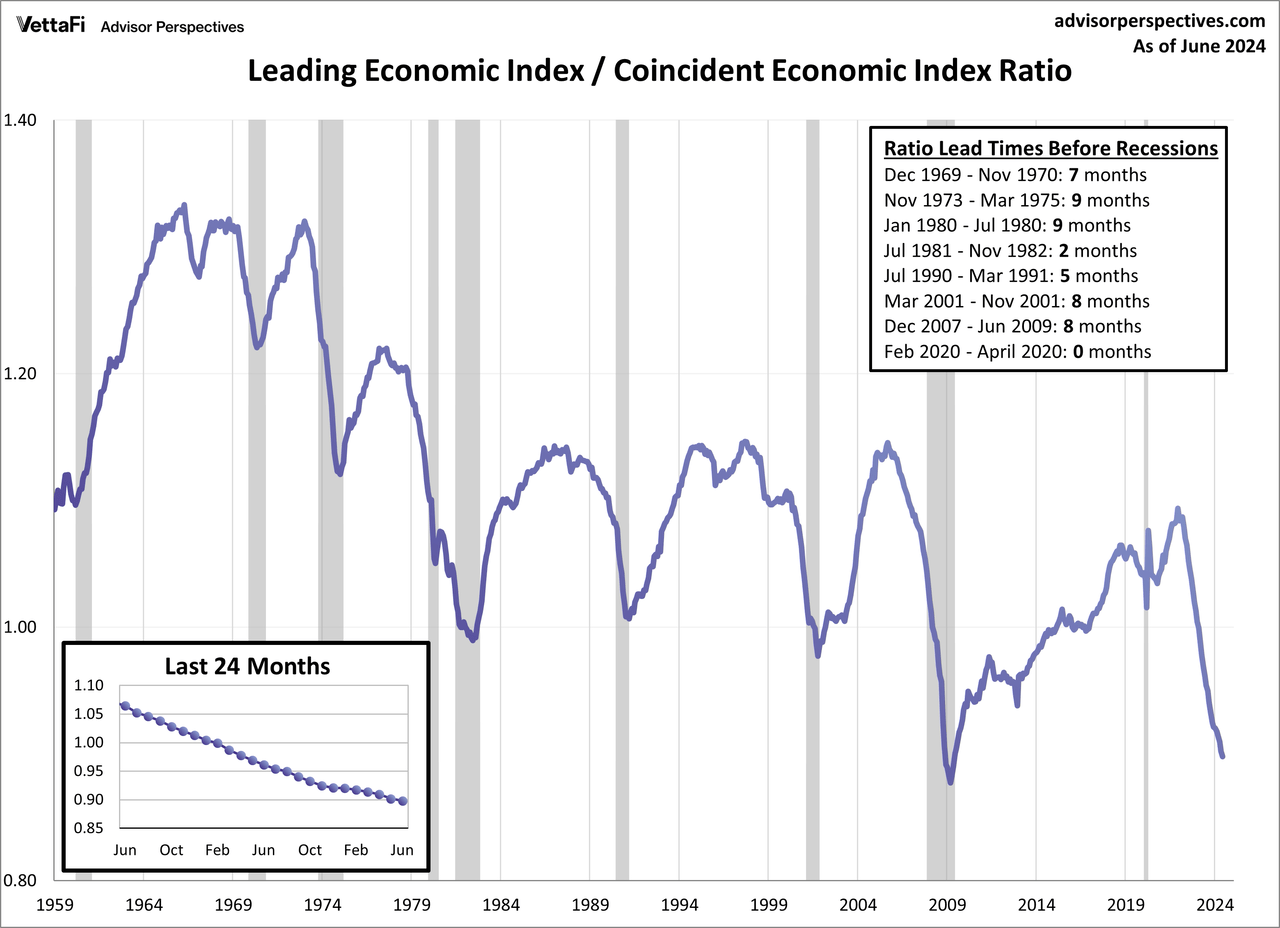
Leading Economic Index and Coincident Economic Index RatioOriginal Post

Editor’s Note: The summary bullets for this article were chosen by Seeking Alpha editors.

Credit: Source link

ShareTweetSendSharePin

Related Posts

Forensic psychologist testifies Lindsay Clancy is ‘criminally responsible’ for children’s deaths
Market & News

Forensic psychologist testifies Lindsay Clancy is ‘criminally responsible’ for children’s deaths

September 24, 2026
Current with Christine Romans – Aug. 25 | NBC News NOW
Market & News

Current with Christine Romans – Aug. 25 | NBC News NOW

September 24, 2026
Full Episode: TODAY Show – Aug. 25
Market & News

Full Episode: TODAY Show – Aug. 25

September 24, 2026
Multiple dead, including children, after Montana shooting and house fire
Market & News

Multiple dead, including children, after Montana shooting and house fire

September 24, 2026
Next Post
Vatican issues apology after Pope Francis uses homophobic slur

Vatican issues apology after Pope Francis uses homophobic slur

Leave a Reply Cancel reply

Your email address will not be published. Required fields are marked *

Search

No Result
View All Result
What Does Anti-Aliasing Actually Do To Your PC Games?

What Does Anti-Aliasing Actually Do To Your PC Games?

September 22, 2026
Tate brothers seek bail as they fight extradition to the U.K.

Tate brothers seek bail as they fight extradition to the U.K.

September 22, 2026
Trump signs order to rename Lake Ontario to ‘Lake America’

Trump signs order to rename Lake Ontario to ‘Lake America’

September 22, 2026

About

Learn more

Our Services

Legal

Privacy Policy

Terms of Use

Bloggers

Learn more

Article Links

Contact

Advertise

Ask us anything

©2020- TradePoint.io - All rights reserved!

Tradepoint.io, being just a publishing and technology platform, is not a registered broker-dealer or investment adviser. So we do not provide investment advice. Rather, brokerage services are provided to clients of Tradepoint.io by independent SEC-registered broker-dealers and members of FINRA/SIPC. Every form of investing carries some risk and past performance is not a guarantee of future results. “Tradepoint.io“, “Instant Investing” and “My Trading Tools” are registered trademarks of Apperbuild, LLC.

This website is operated by Apperbuild, LLC. We have no link to any brokerage firm and we do not provide investment advice. Every information and resource we provide is solely for the education of our readers. © 2020 Apperbuild, LLC. All rights reserved.

No Result
View All Result
  • Main
  • AI & Technology
  • Stock Charts
  • Market & News
  • Business
  • Finance Tips
  • Trade Tube
  • Blog
  • Shop

© 2023 - TradePoint.io - All Rights Reserved!