peshkov/iStock via Getty Images
Greetings from Middleburg. We hope this finds you enjoying summer so far.
The Akre Focus Fund’s (MUTF:AKRIX) second quarter 2024 performance for the Institutional share class was -1.86% compared with S&P 500 (SP500, SPX) Total Return at 4.28%. Performance for the trailing 12-month period ending June 28, 2024 for the Institutional share class was 18.79% compared with 24.56% for the S&P 500 Total Return.
Over the period of October 1, 2023 through March 31, 2024, the Fund had a total return of 26.22%. On the heels of such strong performance, the decline in Q2 was not significant, nor was it consistent with any fundamental concerns we have with the Fund’s portfolio companies. On the other hand, the Fund’s decline during the second quarter felt at odds with an S&P 500 making headlines by hitting new highs.
However, headlines don’t tell the whole story. While the market capitalization-weighted S&P 500 index was up 4.28% and hit new highs during the second quarter, the equal-weighted S&P 500 index declined 2.63% during the quarter. The disparity between the positive performance of the S&P 500 and the negative performance of stocks in general stemmed from the continued distortion caused by the continued strong performance of a handful of the largest market capitalization stocks, headlined by Nvidia (NVDA), whose year-to-date stock price return of over 149% through June 28th lifted its market capitalization to over $3 trillion.
As discussed in our last commentary, what makes the past decade a stock market anomaly is that the best performing stocks have been those of the biggest market capitalization companies. Whether called “FAANGs” or “the Magnificent 7,” the biggest have been the best, and woe to the active manager who does not own them! This is a notable departure from market history. Prior to the past decade, size was the clear enemy of performance; stocks of the largest market capitalization companies tended to lag the performance of the overall index.
|
Performance |
Average Annual Total Returns % as of 6/30/24 |
||||||
|
Net Assets |
QTD |
YTD |
1 YR |
3 YR |
5 YR |
10 YR |
Since Inception 8/31/09 |
|
Retail (MUTF:AKREX) |
-1.94 |
6.01 |
18.47 |
4.54 |
10.87 |
13.03 |
14.80 |
|
Institutional (AKRIX) |
-1.86 |
6.14 |
18.79 |
4.82 |
11.16 |
13.33 |
15.11 |
|
S&P 500 TR |
4.28 |
15.29 |
24.56 |
10.01 |
15.05 |
12.86 |
14.16 |
|
Performance data quoted represents past performance and does not guarantee future results. The investment return and principal value of an investment will fluctuate so that an investor’s shares, when redeemed, may be worth more or less than their original cost. Fund performance current to the most recent month-end may be lower or higher than the performance quoted and can be obtained by calling 1-877-862-9556. The Fund’s annual operating expense (gross) for the Retail Class shares is 1.31% and 1.04% for the Institutional Class shares. The Fund imposes a 1.00% redemption fee on shares held less than 30 days. Performance data does not reflect the redemption fee, and if reflected, total returns would be reduced. Mutual fund investing involves risk. Principal loss is possible. The Fund is non-diversified, meaning it may concentrate its assets in fewer individual holdings than a diversified fund. Therefore, the Fund is more exposed to individual stock volatility than a diversified fund. In addition to large- capitalization companies, the Fund invests in small- and medium- capitalization companies, which involve additional risks such as limited liquidity and greater volatility than larger capitalization companies. |
We grant that some of today’s tech behemoths have competitive advantages, margins, and addressable markets that the mega-caps of yore might only dream of. But can the law of large numbers be suspended completely? Can trees now grow to the sky?
The S&P 500 currently boasts three companies with market capitalizations of $3 trillion or more: Apple (AAPL, ~$3.3 trillion), Microsoft (MSFT, ~$3.4 trillion), and Nvidia (~$3.1 trillion). The monetary value of all “final” goods and services produced by the United States-a.k.a. Gross Domestic Product or “GDP”-was $27.4 trillion in 2023. In other words, these $3 trillion+ market cap companies are currently valued at approximately 12% of GDP-each.
Assume that investors in these three companies expect their market capitalizations to compound at 15% annually over the next decade. Assume US GDP growth of 3% annually over the same period. Satisfying these conditions would require the respective market capitalizations of Apple, Microsoft, and Nvidia to grow from nearly 12% of GDP today to nearly 36% by 2034. Combined, the value of these three businesses would then equate to 107% of US GDP.
The sheer size of these numbers suggests to us that this outcome is unlikely. The value of any group of businesses bears some relationship to the size of the economy in which they operate. For publicly traded businesses, that relationship is often called the “Buffett Indicator” after Warren Buffett referenced it as a broad indicator of stock market value in 2001. It is defined as the total value of the US stock market (measured by the Wilshire 5000 index) divided by nominal GDP. The chart below describes this ratio as of December 31st for the years 1970 through 2023.
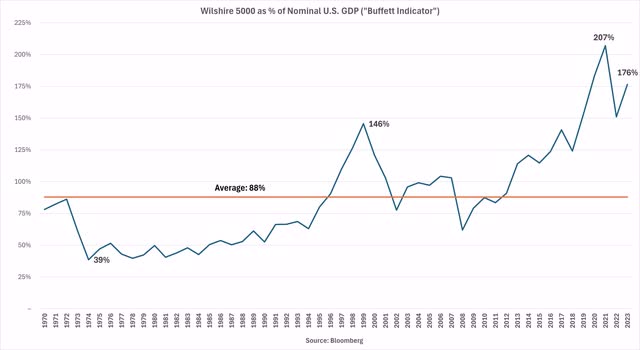
The point of the chart above is not to present a view about the present state of the stock market but to illustrate the dilemma posed by the law of large numbers as it relates to the mega-caps driving the market’s advance. Like the “Big Ten” athletic conference, the Wilshire 5000 is something of a misnomer. At its peak, the Wilshire 5000 contained over 7,500 stocks. As of March 31, 2024, it comprised only 3,381 stocks. The chart above shows that the combined market capitalization of all 3,381 were required to equate to 176% of 2023 GDP as of last yearend.
The historic average stock market value to GDP ratio is 88%, with said stock market value comprised of thousands of publicly traded companies. For Apple, Nvidia, and Microsoft to compound at 15% over the next decade (a rate we suspect is lower than many hope for) demands that the market capitalizations of just these three companies total 107% of total US GDP under the scenario described above. Can investors realistically expect three businesses to achieve what historically required thousands? This would present a precariously top-heavy situation indeed. Impossible? We never like to say never. Who in the 1970s or 1980s imagined individual businesses achieving market caps of $1 trillion, let alone $3 trillion? Nor are we casting aspersions on any of these fine businesses. Our point is simply that size ultimately matters to returns; that no tree has yet grown to the sky. To believe that today’s trillion-dollar mega-caps can continue to compound at anything close to their historic rates is to believe otherwise, pure and simple.
In our Fund at quarter end, Visa (V) was by far the largest market capitalization business at $539 billion. MasterCard (MA), at $410 billion, was a distant second. In third place was Danaher (DHR) at $185 billion. The market cap of every other business ranged from $7 billion to $98 billion. The median market capitalization in our Fund stands at $65 billion. Size-wise, the businesses we own are small next to the giants of the Magnificent 7, that much less susceptible to the law of large numbers.
We do not own the mega-caps overwhelmingly responsible for driving index performance in recent years. Our holdings do not include the present exemplars of A.I., at least in the popular imagination. If the stock market in the short-term is a voting machine, our holdings might not poll as well as the Magnificent 7s of the world, ownership of which has practically become a litmus test for manager competence (and perhaps sanity). It is when we consider the stock market as a weighing machine over the longer term that we breathe easy. The Fund owns what we consider exceptional businesses, managed by skilled executives, with extensive opportunities to reinvest and so compound our capital. These businesses are neither the largest nor most popular. Looking forward, we see this as a plus.
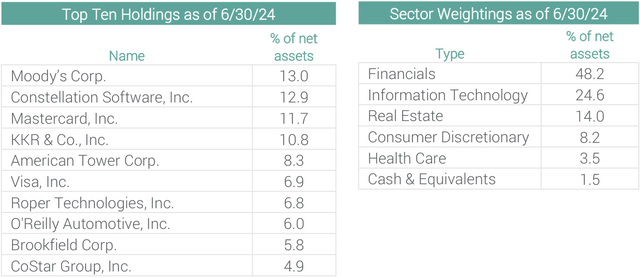
The top-5 contributors to performance during the quarter were Moody’s (MCO), Constellation Software (OTCPK:CNSWF), KKR, Roper Technologies (ROP), and American Tower (AMT).
The top-5 detractors from performance this quarter were CoStar Group (CSGP), Mastercard, Visa, O’Reilly Automotive (ORLY), and CarMax (KMX).
Cash and equivalents stood at 1.5% of the Fund as of June 28th.
We wish you a wonderful summer and thank you for your continued support.
Sincerely,
John
|
The composition of the sector weightings and fund holdings are subject to change and are not recommendations to buy or sell any securities. Cash and Equivalents include asset backed bonds, corporate bonds, municipal bonds, investment purchased with cash proceeds for securities lending, and other assets in excess of liabilities. The S&P 500 TR is a broad-based unmanaged index of 500 stocks, which is widely recognized as representative of the equity market in general. It is not possible to invest directly in an index. The Fund’s investment objectives, risks, charges, and expenses must be considered carefully before investing. The summary and statutory prospectus contains this and other important information about the investment company and it may be obtained by calling (877) 862-9556 or visiting Home – Akre Focus Fund. Read it carefully before investing. The Akre Focus Fund is distributed by Quasar Distributors, LLC. |
Original Post
Editor’s Note: The summary bullets for this article were chosen by Seeking Alpha editors.
Editor’s Note: This article discusses one or more securities that do not trade on a major U.S. exchange. Please be aware of the risks associated with these stocks.
Credit: Source link