
kentoh/iStock via Getty Images
Investment Outlook
PTC Inc. (NASDAQ:PTC) provides a wide array of lifecycle management software and services to various industries worldwide.
I previously wrote about PTC in May 2023 with a Hold outlook due to flat organic bookings growth.
Despite a challenging sales environment for transformational deals, the company has produced revenue and earnings growth as it works to maximize value from its 2023 acquisition of ServiceMax.
While PTC Inc. stock isn’t cheap, my outlook is a Buy at around $180 per share.
PTC’s Market And Approach
A 2022 market research report by Grand View Research estimates the global market for product lifecycle management [PLM] accounted for $26.9 billion in 2021 market value, and was expected to exceed $56 billion by 2030.
If achieved, this growth would be a moderately robust CAGR of 8.6% from 2022 to 2030.
The primary reasons for this growth trajectory are an increasing demand for cloud-delivered PLM solutions across a secure IT infrastructure and a growing desire from customers seeking to develop “smarter” products and manufacturing operations.
The chart here shows Grand View’s forecasted growth path for the U.S. Product Lifecycle Management market from 2020 to 2030:
Grand View Research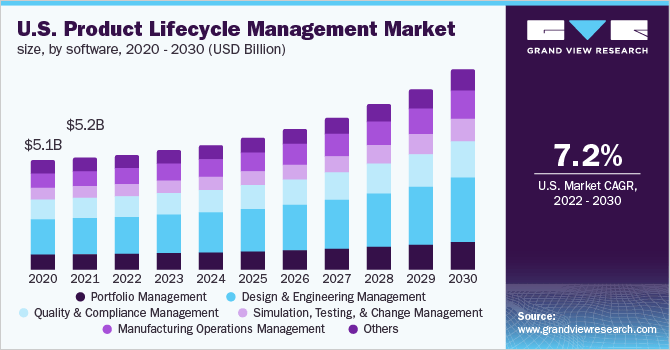
Significant competitive or other industry participants include:
-
Aras
-
Arena Solutions
-
Oracle
-
SAP
-
Autodesk
-
Siemens.
PTC also provides software and services for the CAD/CAM, Industrial IoT and service execution markets, which are large end markets in themselves.
The company reports revenue for three segments, and FQ2’s breakdown is shown in the following pie chart:
Seeking Alpha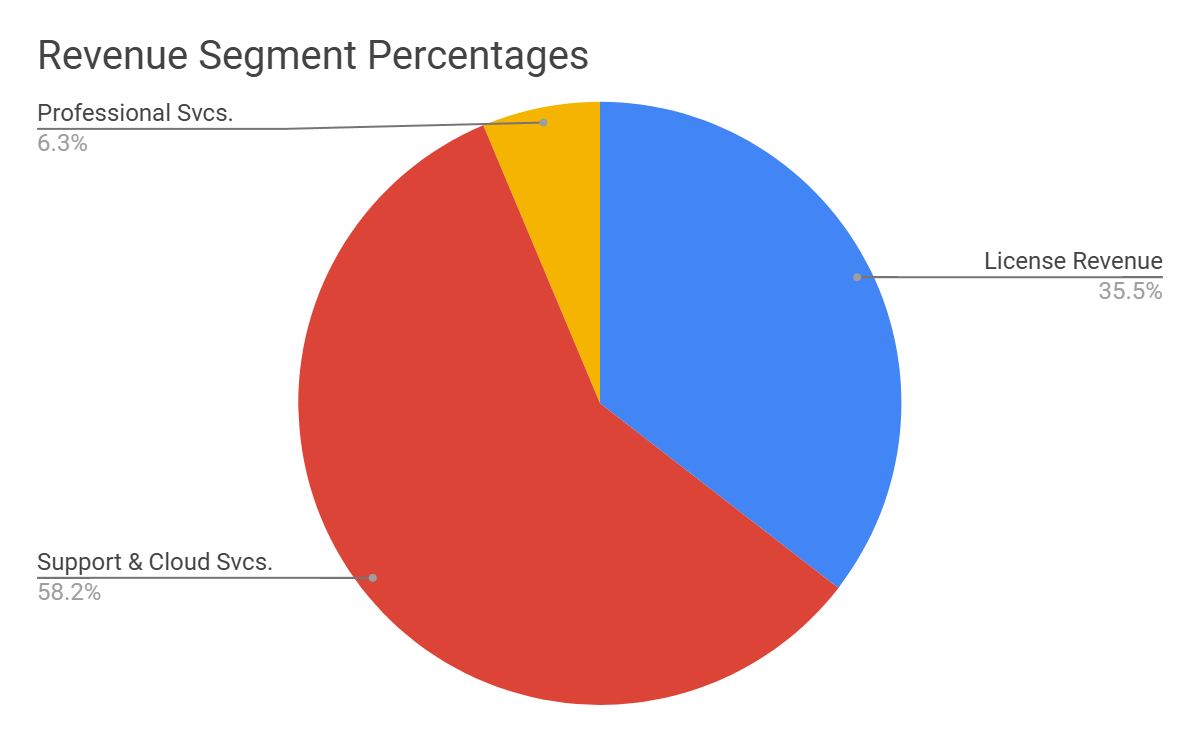
The company focuses its sales strategy on five product areas of PLM, ALM, SLM, CAD and SaaS.
Management has been increasing its focus on cross-selling the ServiceMax SLM system to PTC’s existing customer base
Recent Financial Trends
Total revenue by quarter (columns) has resumed growth after several quarters of flat results; Operating income by quarter (red line) has also turned up due to higher gross margin and reduced operating expenses.
Seeking Alpha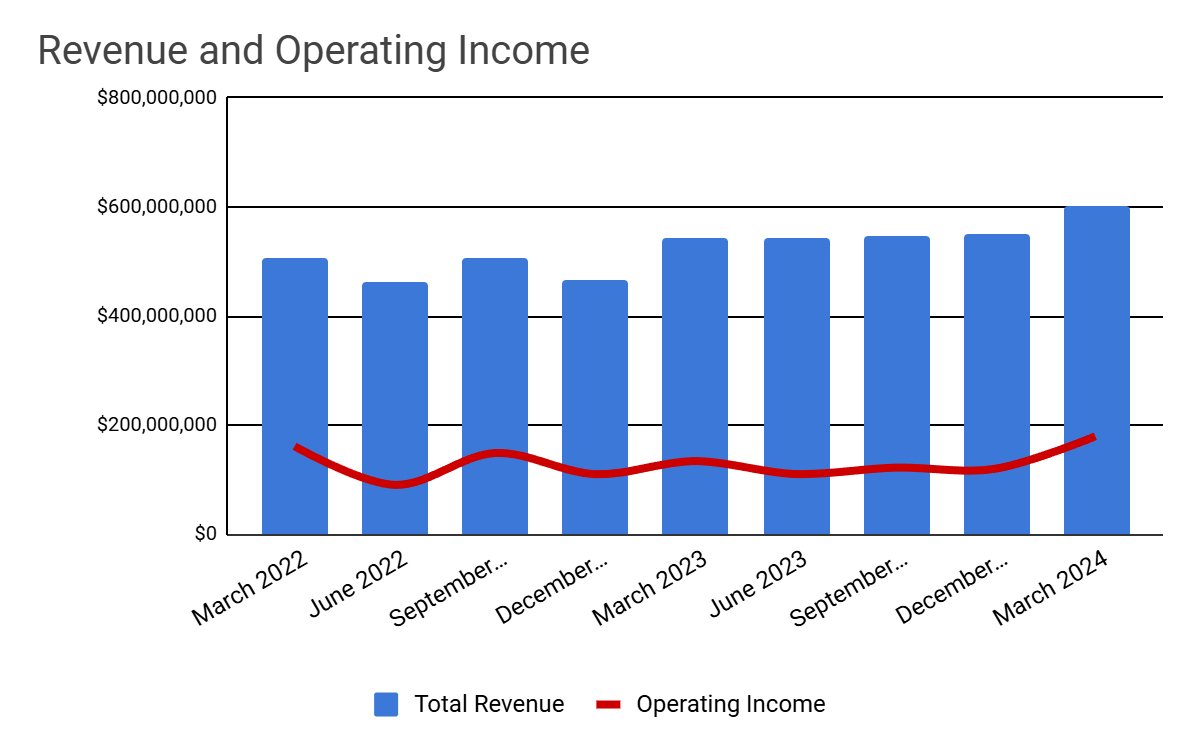
Gross profit margin by quarter (green line) has risen as a result of improving scale economies; Selling and G&A expenses as a percentage of total revenue by quarter (orange line) have turned lower sequentially and year-over-year due to a continued focus on cost reductions; R&D expenses as a function of revenue (purple line) were flat YoY as the company manages internal spending based on ARR growth levels.
Seeking Alpha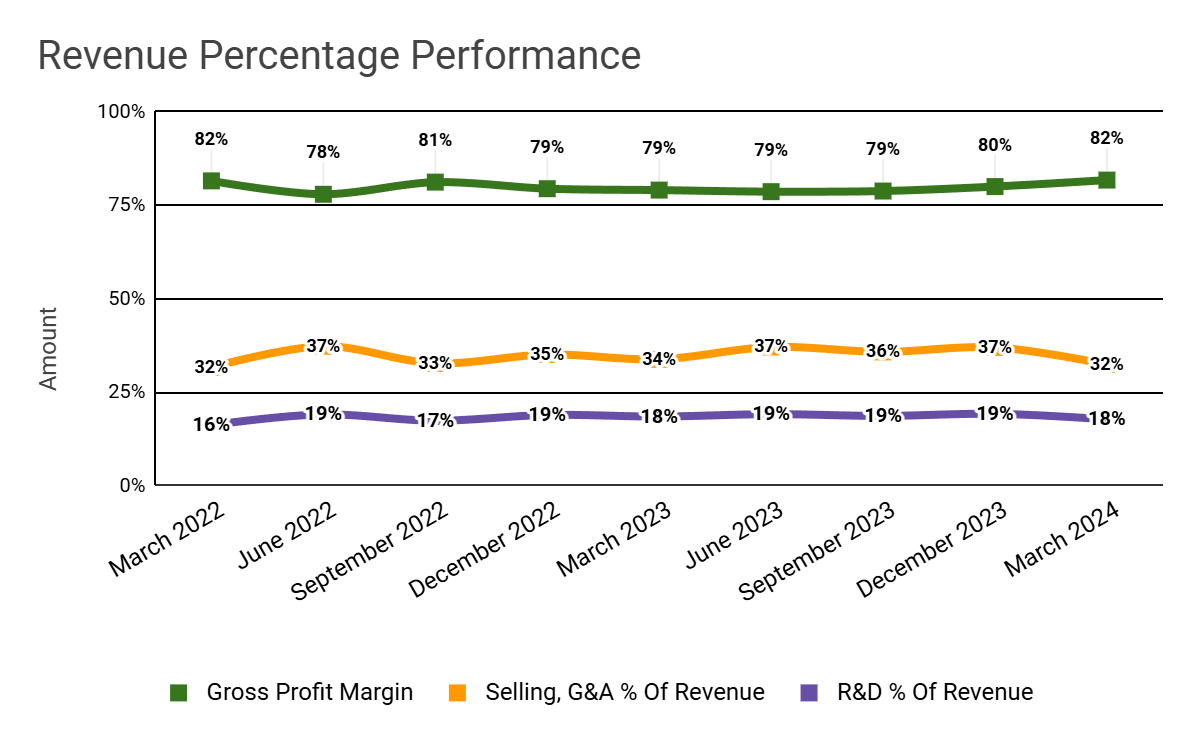
Earnings per share (Diluted) have risen markedly in the most recent quarter due to a combination of rising revenue and more static expenses.
Seeking Alpha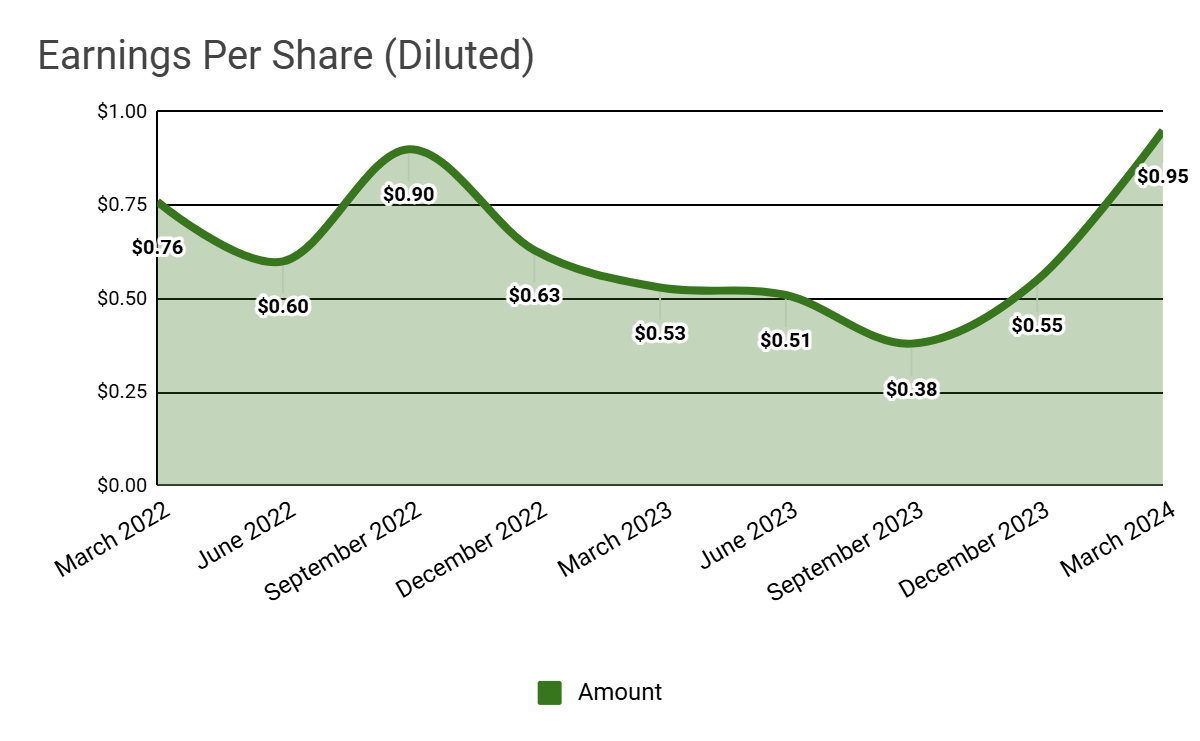
(All data in the above charts is GAAP.)
For balance sheet results, PTC ended the quarter with $249 million in cash and equivalents and about $2.0 billion in total debt, of which approximately $1.5 billion was long-term.
During the past twelve months, free cash flow was a strong $638 million and capital expenditures were only $19.1 million. The company paid a very high $225.9 million in stock-based compensation, or SBC, in the last four quarters.
In the previous year, PTC’s stock price has gained 25.5% vs. that of the iShares Expanded Technology-Software ETF’s (IGV) rise of 22.3%, as the chart shows here.
TradingView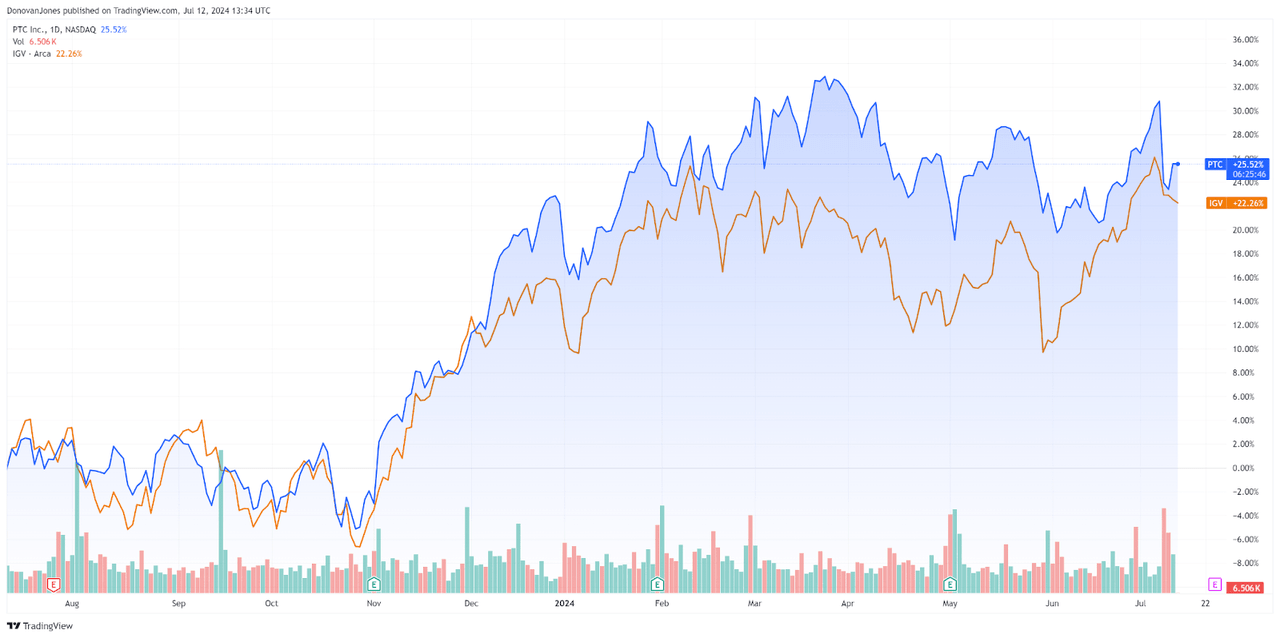
The following is a major financial and operating metrics table that I find helpful for looking at the company’s performance and forward guidance expectations:
|
Metric |
Amount |
|
EV/Sales (“FWD”) |
10.0 |
|
EV/EBITDA (“FWD”) |
24.1 |
|
Price/Sales (“TTM”) |
9.4 |
|
Revenue Growth (“YoY”) |
13.3% |
|
Net Income Margin |
12.8% |
|
EBITDA Margin |
27.1% |
|
Market Capitalization |
$21,160,000,000 |
|
Enterprise Value |
$23,100,000,000 |
|
Operating Cash Flow |
$657,060,000 |
|
Earnings Per Share (Fully Diluted) |
$2.39 |
|
2024 FWD EPS Estimate |
$4.91 |
|
Rev. Growth Estimate (“FWD”) |
10.1% |
|
Free Cash Flow/Share (“TTM”) |
$5.35 |
|
Seeking Alpha Quant Score |
Hold – 2.95 |
(Source: Seeking Alpha.)
PTC has substantially improved its Rule of 40 performance year-over-year, with the most improvement in its top-line revenue growth results:
|
Rule of 40 Performance (Unadjusted) |
FQ2 2023 |
FQ2 2024 |
|
Revenue Growth % |
5.3% |
13.3% |
|
Operating Margin |
27.9% |
29.8% |
|
Total |
33.2% |
43.1% |
(Source: Seeking Alpha.)
Why I’m Bullish On PTC
PTC has produced growing revenue on mostly flat operating expenses, indicating increasing operating leverage.
With the acquisition of ServiceMax 18 months ago, the company has been seeking to maximize revenue growth by cross-selling its service lifecycle management capabilities to its existing customers. Management has aligned its sales team with ServiceMax’s team to improve those results.
The chart below shows important keywords in the recent analyst conference call with management:
Seeking Alpha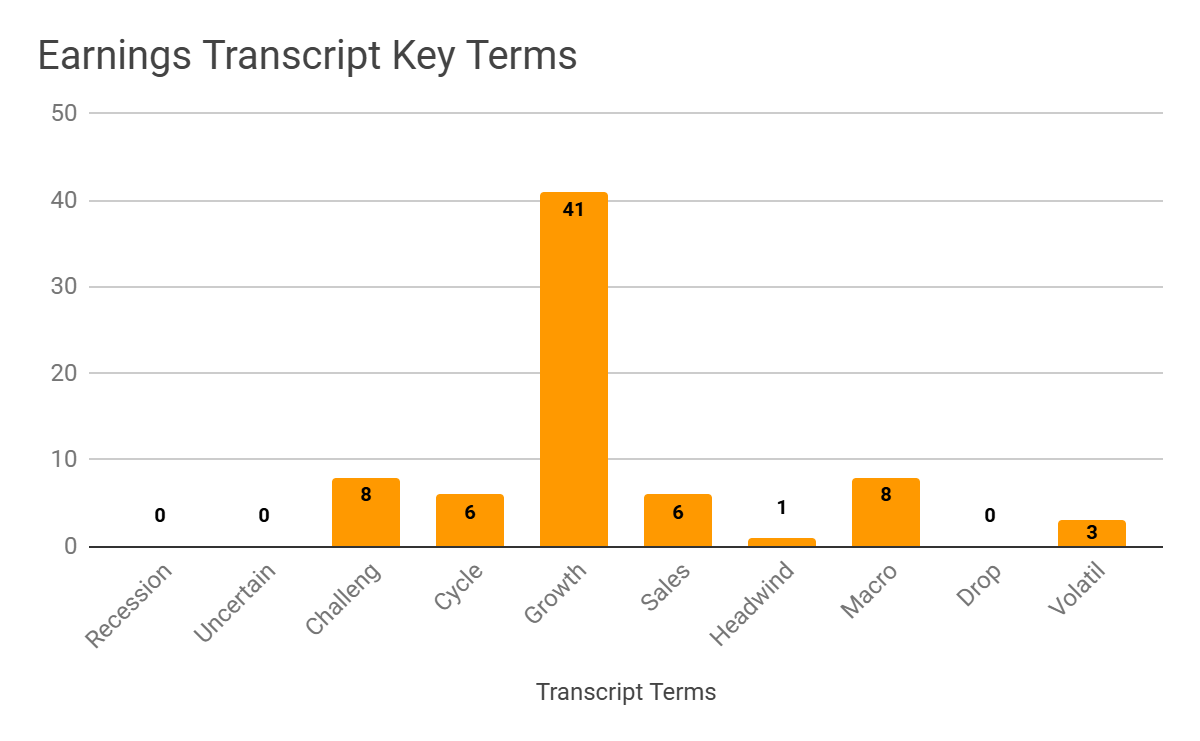
The chart shows that PTC is still experiencing challenges in a sluggish sales environment, which has proven to negatively impact larger, transformational deals.
As to valuation, the table below shows comparisons to competitor Autodesk (ADSK):
|
Metric |
Autodesk |
PTC |
Variance |
|
EV/Sales (“FWD”) |
8.9 |
10.0 |
12.2% |
|
EV/EBITDA (“FWD”) |
23.4 |
24.1 |
2.9% |
|
Rev. Growth Estimate (“FWD”) |
10.5% |
10.1% |
-3.8% |
|
Net Income Margin |
17.7% |
12.8% |
-27.3% |
|
Operating Cash Flow |
$1,080,000,000 |
$657,060,000 |
-39.2% |
(Source: Seeking Alpha Data.)
So, the market is valuing PTC at slightly higher multiples despite a lower growth rate and lower net income margin.
A full comparison of the two company metrics and performance results can be viewed here.
Furthermore, using a different approach to valuation, the market is currently valuing PTC at an EV/Sales multiple of around 10x on an estimated NTM revenue growth rate of 10.1% versus a median Meritech SaaS Index implied ARR growth rate of around 18% (Source).
The Meritech Capital Index of publicly held SaaS application software companies produced a forward EV/Revenue multiple median of around 5.2x on June 21, 2024, as the chart illustrates below:
Meritech Capital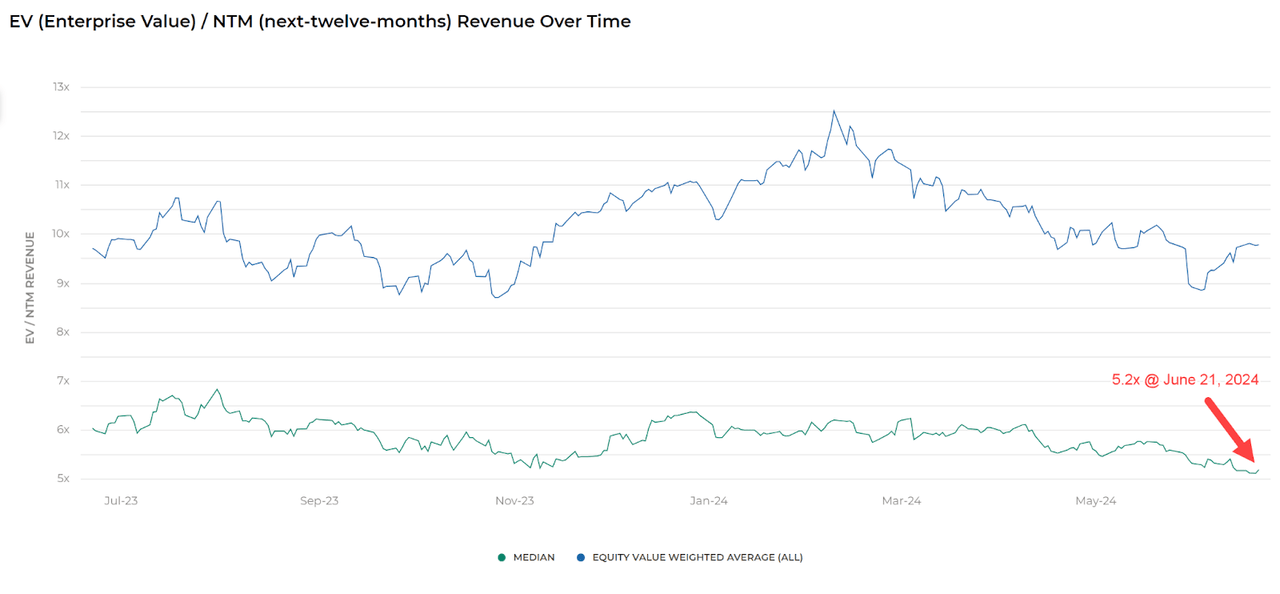
So, by comparison, PTC is currently valued by the market at a premium to the broader Meritech Capital SaaS Index as of June 21, 2024, likely due to the firm’s strong earnings results.
Risks to the company near-term include a mild macroeconomic slowdown that may already be underway and longer sales cycles, which may reduce its revenue growth potential.
However, management is guiding ARR growth in the range of 10% to 12%, which would be close to its trailing twelve-month growth rate of 13%.
The company appears to be diversifying its offerings, which provides it with cross-selling opportunities that it is exploiting.
Despite this, my judgment is that PTC appears slightly higher-valued compared to Autodesk and has produced better returns over the long term.
While valuation isn’t cheap, PTC has performed better than other industry participants and the wider ETF benchmark of (IGV), in the face of a challenging last six quarters.
Given the firm’s continued focus on maximizing the accretion from its ServiceMax acquisition and an improving topline revenue and earnings trajectory on a stable cost structure, I’m Bullish on PTC Inc. shares at around $180 per share.
Credit: Source link