

South_agency
In this article, we update our view across the CLO senior security space. Specifically, we look at baby bonds and preferreds of investment funds (both CEFs and BDCs) that allocate primarily to CLO Equity and Debt securities.
Although these securities don’t have the double-digit yields of their common share counterparts, they do offer high single-digit yields as well as much lower volatility and stronger protections. This is why they continue to be part of our Income Portfolios, particularly in the current period of expensive credit valuations.
First, we highlight the attractive features of this part of the market. We then do a quick survey of the different ways investors can allocate their capital, run a couple of head-to-head comparisons and discuss the various common pitfalls. Finally, we round out the article by looking at the risk/reward on offer across the sector and highlight our picks.
Why CLO Senior Securities Are Worth A Look
The CLO senior security sector is a niche area of the broader income sector. It includes preferreds and baby bonds issued by investment funds (both CEFs and BDCs) that primarily allocate to CLO Equity and Debt securities.
What makes the sector attractive is not just the risk/reward on offer but also a number of additional factors. Specifically, because CEF and BDC sectors are relatively bifurcated (few income investors are well-versed in both sectors), there are greater relative value opportunities than in other parts of the income market. And because the key risk metric investors use (i.e. asset coverage) is somewhat misleading, it’s easy for investors to go astray. Both of these factors generate a significant amount of alpha for investors willing to put in the work.
The preferreds and baby bonds of the various CLO Equity funds tend to be overshadowed by their common shares, which deliver incredible yields at an even more incredible volatility. However, for investors who want to acquire income securities with attractive absolute and risk-adjusted yields, senior securities may be more appealing.
This sub-sector has a number of unusual and attractive features. First, nearly all securities have mandatory maturities, even the preferreds. This significantly lowers their duration, derisks them, and makes them less negatively convex from large changes in interest rates.
Secondly, a number of securities in the sector are monthly payers, which is both attractive for many investors and understates their yield relative to the usual quarterly-paying preferreds due to the additional compounding.
Thirdly, the sector features unusual mandatory redemption features, which require the funds to redeem the securities if their asset coverage remains below a given level.
Fourthly, the sector has enjoyed repeated support from fund managers who tend to repurchase shares of their preferreds and baby bonds during drawdowns (otherwise they would not be allowed to pay distributions on common shares). This not only improves the asset coverage of the senior securities but also supports their prices in the market.
Investor Options in the CLO Space
Let’s go through the different investment options in the sector:
- Investors can hold CLO funds indirectly via private funds / managed accounts or public funds such as CEFs and BDCs. CLO Equity CEFs include popular vehicles such as OXLC, ECC, OCCI, EIC, XFLT, CCIF and tend to boast very high yields of around 13-20% or so.
- Preferreds are a lower-beta and lower-risk way to allocate to the CLO Equity space, with high-single digit yields. The market does not really distinguish between term and perpetual preferreds in this subsector, nor between lower and higher-risk preferreds.
- Baby bonds are a further up-in-quality way to allocate to the CLO Equity space. The handful of baby bonds trade at yields around 7-8%. It’s not unusual to see bond yields trade near the yields of the preferreds of the same issuer, which highlights the inefficiency of the pricing in the sector.
Key Metrics
When comparing CLO CEF senior securities, there are several key metrics to look at. One, is the composition of the fund itself. CLO funds typically hold CLO Equity, CLO Debt, and individual loans and occasionally bonds. The greater the composition skews to the right of these asset types (i.e. the higher the allocation to individual loans and the lower to CLO Equity etc.), the lower risk it is, all else equal. For example, CCIF is almost entirely in CLO Equity while EIC is almost 80% in CLO Debt – a significantly lower risk type of security. The variation in asset allocation, and hence risk profile, is very large in the subsector despite all of these funds being “CLO” funds.
The second key metric is leverage. The higher the leverage inside the fund, the more risk there is for the senior security holders, all else equal. Leverage varies between around 25% to 45% – a very large range. Clearly, leverage is a moving target that can go up and down, but it’s very much worth paying attention to and the lower this number, the better for senior security holders.
Third, is the amount of secured debt there is in the capital structure. Secured debt gets paid off first before unsecured debt and preferreds do, so the less secured debt there is in the capital structure, the more assets there are to share for unsecured bonds and preferreds. Most of the funds don’t carry secured debt, which is a win for the unsecured bonds and preferreds and those that do tend to have a lower risk profile. This is because secured debt like repo tend to have fairly strict covenants, which are often breached during periods of sharp drawdowns. OXLC has learned this the hard way as it has been repeatedly blown out of its repo borrowings, which it has now given up on.
Comparing these three metrics is challenging, so we combine them into a single metric – the Stress Test Recovery – which is based on a tough scenario where CLO Equity securities are valued at 15% and CLO Debt securities are valued at 40% and other “linear” securities like loans and bonds are valued at 60%. In our view, it provides a much better way to gauge risk than the more popular asset coverage metric.
If we combine this metric with yield, we get the chart below. The highlighted quadrant is the “good quadrant” of high Stress Test Recovery and high yield.
Systematic Income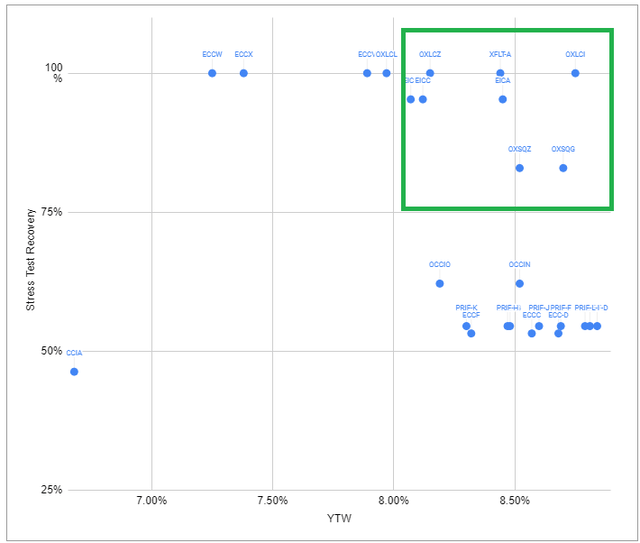
The securities we would highlight as most attractive on the risk / reward spectrum are the following:
- EIC 5% 2026 Series A preferred (EICA) has a short maturity of Oct-2026, with the underlying portfolio having the lowest proportion of CLO Equity (it is mostly BB-rated CLO Debt). This allows the preferred to remain nearly whole in our stress test scenario. EICA trades at an 8.45% yield.
- XFLT 6.5% Series 2026 preferred (XFLT.PR.A) has an even lower risk profile, with nearly half the portfolio in individual loans. The fund’s leverage is elevated; however, the stress test scenario leaves the preferreds whole. XFLT.PR.A trades at an 8.4% yield.
- OXLCI (OXLCI) is the upcoming bond from the CEF OXLC, and it has not yet started trading. At par, its yield of 8.75% would be attractive both in absolute terms and relative to its sister bonds OXLCL and OXLCZ which are trading at significantly lower yields of 8-8.15%.
- OXSQG (OXSQG) is a 2028 bond issued by BDC OXSQ whose portfolio is roughly evenly distributed between individual loans, CLO Equity and CLO Debt. Although it has an elevated level of leverage (BDCs tend to trade at a higher leverage than CEFs), the portfolio is relatively low-beta and there is no secured debt, which results in a solid stress test. OXSQG trades at an 8.7% yield.
These securities are good examples that investors can take a cautious approach to income investing in a period of expensive credit valuations without entirely giving up on high yields.
Credit: Source link