

tum3123
Introduction
iShares MSCI Emerging Markets ETF (NYSEARCA:NYSEARCA:EEM) is a well-known fund in the ETF space, providing investors with exposure to large and mid-sized companies in emerging markets. The fund’s inception date was April 7, 2003, and its mandate is to follow its benchmark index, the MSCI Emerging Markets Index. At present, EEM has 1,241 holdings (July 3, 2024), with a 30-day SEC yield calculated as 1.79% (as of the end of May). Assets under management are now over $19.4 billion, with an expense ratio of 0.70%.
That expense ratio is quite high, however the mandate to invest in emerging markets leaves some room for acceptance in higher running costs, since foreign stocks are often costlier to transact in and can be more difficult to access for conventional U.S. investors. Investors may also often see more active traders discuss the EEM fund; shorter-term traders may be less concerned with annual expense ratios. In any event, overall net fund flows are evidently currently in the red, but these net outflows are front-loaded.
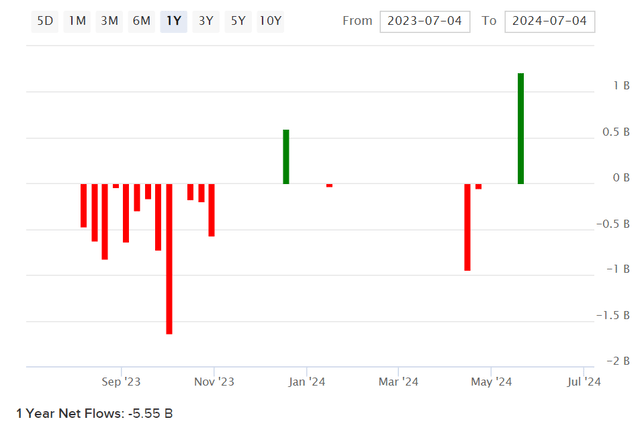
EEM Net Fund Flows (ETFDB.com)
More recently, net fund flows are actually positive. After a trailing twelve months of negative fund flows (-$5.6 billion), net fund flows into EEM are positive by circa +$216 million, indicating the potential for some reversal.
My last article on EEM, published right at the start of January 2022, was ill-timed. I thought EEM was well-positioned on a value basis. I did advise against a large allocation due to characteristic volatility, but the valuation looked interesting while the implicit short-USD hedge was additionally appealing. The Russo-Ukrainian War that escalated in early 2022 sent Russian stocks tumbling; before this, EEM did have Russia exposure, so it makes sense in hindsight that EEM suffered terribly through 2022. That is, before we consider that 2022 was a horrible year for investing in general (whether in equities or bonds, globally). It makes sense to revisit the valuation today, whereas today the fund has zero direct Russia exposure, and interest rates are more likely to fall than rise in the majority of the western world.
Valuation
We should start by acknowledging that EEM has several geographical exposures, with the greatest being China. I have produced the chart below from the data provided by iShares themselves, as of July 3, 2024. The fund is heavily exposed to China (25.23%), which is another area of geopolitical concern, but whereas this concern is far less “immediate” or urgent, or indeed consensus, as compared to Russia and Ukraine.
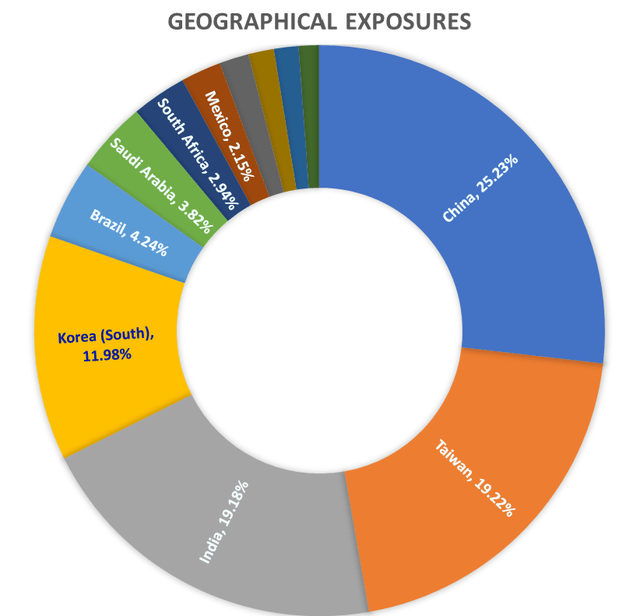
EEM Geographical Exposures (Data from iShares.com)
Regardless of one’s geopolitical projections, the geographical exposures should be integrated into the valuation as they govern the overall weighted country risk premium and risk-free rate that should apply. Using data from Professor Damodaran for country risk premium estimations (updated July 2024), and 10-year bond yields internationally, I arrive at a weighted country risk premium of 1.39% and a weighted 10-year yield of 3.69%.
Moving on, I will acknowledge the expense ratio of 0.70% and the bid/ask spread (per iShares) of 0.02% (which is low, supported by relatively high liquidity in this well-known fund).
The fund’s most recent factsheet, as of June 28, 2024, indicates trailing and forward price/earnings ratios of 15.99x and 12.27x, respectively, suggesting a forward one-year earnings growth rate of 30.32%, with a forward return on equity (implied) of 14.59%. The forward earnings yield is 8.15%, which is in theory the yield you would get on the fund if (all else equal, including FX rates) all earnings were paid out as dividends. In reality, the indicative dividend yield at the end of June was 2.63%, indicating a payout ratio of closer to 32%. Going forward, I will assume a third of earnings are paid out, and no buybacks for the sake of simplicity (and modest conservativeness).
Morningstar’s consensus analyst estimates for three- to five-year average earnings growth for EEM’s portfolio is printed at 14.12%. To retain some level of conservativeness, we will under-cut the consensus for now, at circa 8.37-12.84% (a midpoint of 10.61% over three to five years, which is 8.37% over the full five years we are projecting, here). This basically has the effect of producing a projection whereby earnings growth are quick to begin with, but drop back to an inflation-like 2% by year 4, with the return on equity maturing down to sub-12% by year 5. Everything considered, the implied headline IRR is 10.16% per annum.
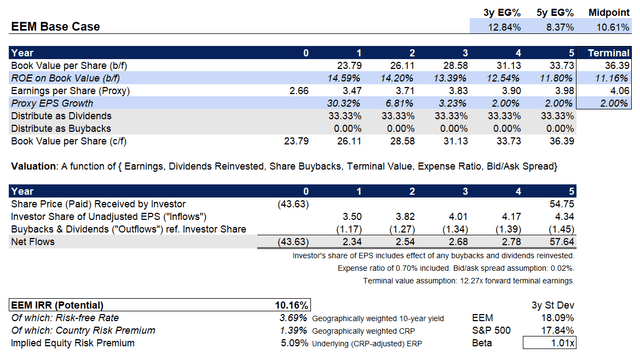
Valuation Gauge for EEM (Author’s Calculations)
Generally speaking, I would say EEM looks like it is between fairly valued and undervalued. Most would agree that equities are generally bullish, but some countries and sectors are not so bullish. EEM has been decidedly bearish in recent years, and so a possible upward reversal is on the horizon. Having said this, investor pessimisim with respect to China still seems palpable, and so I would expect relatively elevated equity risk premiums embedded in China-exposed stocks, which should include Taiwan (representing a further 19.22% of the fund, for a total of 44.45%, if counting both countries together).
Elevated equity risk premiums can create opportunity, but only if “nothing bad happens”, so to speak. You get paid for holding the implicit risk. Should there be any more serious geopolitical developments with respect to China over the next five years (real or perceived), EEM’s valuation is very likely to struggle. Having said this, the present valuation already indicates a higher level of uncertainty, since in spite of relatively low fund beta (roughly matching the S&P 500 U.S. equity index) the implied ERP is 5.09%, as compared to a fair value range in my view of 3.2-4.5% for diversified equity portfolios.
Finally, I would draw attention to current business cycle positioning, as per the chart below from Fidelity. Markets tend to lead the business cycle by about 6-18 months; in other words, by about a year or so.
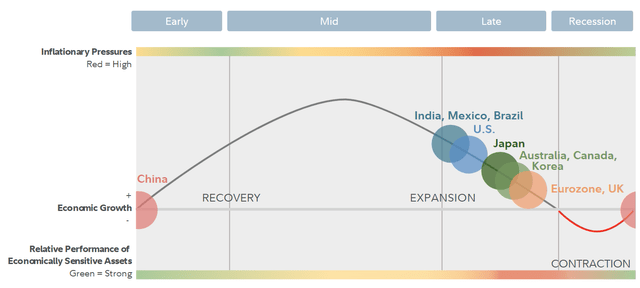
Global Business Cycle Positioning (Fidelity.com)
At the moment, the U.S. and much of the western world is in the later stages of the current business cycle. Interestingly, EEM’s exposures include several countries across the business cycle (at least, across the late and recession/early stages). So, you could argue that EEM is well diversified from a business cycle standpoint, though given the large U.S. investor exposure, the underlying stocks are still likely to be subject to the whims of U.S. monetary policy. Thankfully, the Fed is signalling a generally steadier position now, with rates more likely to fall than rise, going forward.
Meanwhile, the overall sector exposures of EEM are relatively balanced across “Cyclical” and economically “Sensitive” sectors.
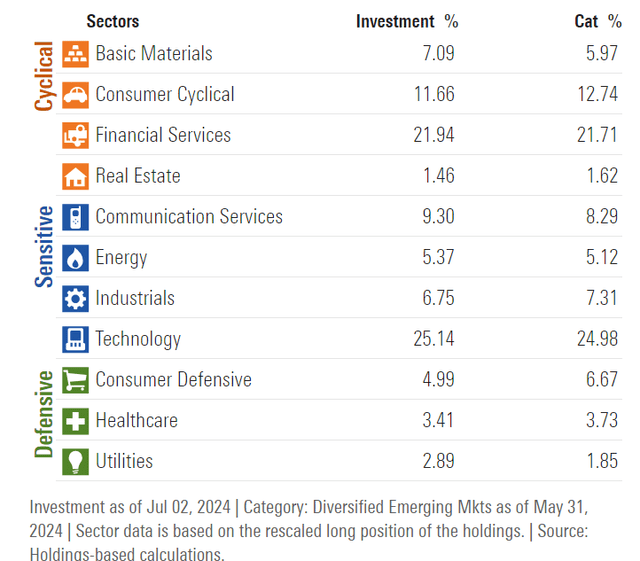
EEM Core Sector Exposures (Morningstar.com)
What I see, then, is a somewhat undervalued and diversified ETF with potential cyclical sensitivity that could benefit as global (but U.S.-weighted) monetary conditions are likely to support stronger risk sentiment. The implicit USD hedge remains as an additional point of interest, since EEM holds stocks that are ultimately denominated in foreign currencies.
Given geopolitical uncertainties, most investors would probably be wise not to allocate a significant portion of their portfolios to EEM (say, no more than 10% at the very most; most would probably prefer to stay under 5%). However, I would take a bullish stance on EEM at present, based on a relatively soft valuation, and the fund’s generally well diversified portfolio of over 1000 holdings across several core countries and all sectors. Allocation limits are however advised, especially given the high Chinese exposure, which is indeed probably a primary driver of the fund’s relatively soft valuation.
Credit: Source link