

Fabrice Cabaud
Investment thesis
Following a >20% decline in its stock price, I wanted to check whether J.B. Hunt Transport Services (NASDAQ:JBHT) was an investment grade company, or whether the embedded risk was too great to allocate some of my precious, hard-earned capital. Founded in 1961, the company is headquartered in Arkansas and is one of the largest surface transportation, delivery, and logistics companies in North America.
It operates five distinct [yet highly complementary] business segments that conduct operations in the transportation + logistics market. It also provides logistics brokerage services as an ancillary offering. The company is asset-heavy with a fleet of ~100,800 registered chassis, including ~6,000 of its own tractors.
Figure 1.
Seeking Alpha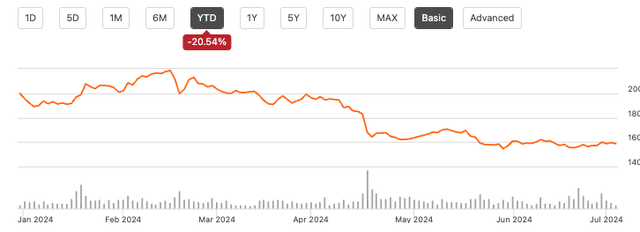
The stock is down from 52-week highs in February and trades >20% off this level and thus my questions are – 1) what caused the repricing, 2) has anything fundamentally changed for the company, 3) what’s the economics of this business, and the range of scenarios should it continue as it has done in the last 3 years, and 4) what’s it worth?
Critically, my opinions on each question above are flat for JBHT as it appears several risk factors could prevent total shareholder return (“TSR”) in the next 3-5 years. The investment debate is balanced due to an evenly biased risk/reward calculus.
Consequently, I am hold on JBHT due to 1) declining returns produced on capital employed in its operations [management keeps throwing cash back into the business, but profits are lumpy], 2) absent competitive advantage period (“CAP”) as a result of this, driven by 3) capital turns reducing below LT 2x average [capital efficiency is a competitive advantage for the company, so the fact this is fading is a potential concern], and 4) lack of valuation upside from these facts. Net-net, I believe the company is worth ~$175–$180/share today and could reach this level by FY’26E [3.4%–4.4% CAGR respectively]. As such, my estimate for the TSR on JBHT stock in the coming 12 months is ~3.2% including dividends.
Business characteristics – balanced debate
JBHT has several attractive characteristics that balance the debate and qualify it as a company with 1) a strong balance sheet, 2) durable revenues, and 3) ongoing dividends to support the case. The following factors are also standouts:
-
Breadth of service: Logistics is a commodity-type service and thus it is a volume vs. margin affair to compete in these businesses. JBHT is a high sales, volume, low-profit margin company that historically enjoys highly efficient assets as an advantage [although, this is waning, as discussed later]. Turnover on capital employed is historically >2x on ~7-8% pre-tax margins, vs. ~1.2x for cargo ground transportation industry peers. It doesn’t enjoy pricing advantages [gross + operating margins approx. = to industry avg., showing its prices about the same], but due to the rate of turnover on its capital clips >2x greater returns on capital than the industry.
-
In my view this is due to 1) sheer sales volume [JBHT highest in the industry at ~$12.5 billion in the TTM, vs. Ryder System (R) at ~$11.9 billion, then XPO Inc (XPO) at ~$7.8 billion], and 2) this volume gives it a greater breadth of offerings, enabling it to compete on volume vs. price. In a capital-intensive business, this can be a major advantage when asset replacement values are fair.
Figure 2.
Seeking Alpha, Bloomberg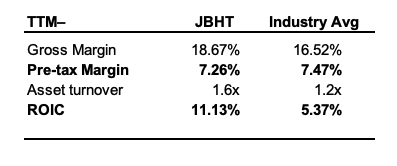
-
Rail collaboration: The company has strategic arrangements with most major North American rail carriers, enabling the transport of freight in containers or trailers, while JBHT handles the majority of pickup and delivery services. This is a relatively streamlined process and the integration fits with my points above on the breadth of offering and the advantage it has in producing earnings on its assets. It also provides more tailored solutions as a higher-margin offering.
- JBHT is highly FCF productive and has been economically valuable in the past – for instance, ROICs have been >12% for most of FY’21–’23, despite sliding to 11.1% in the last period. Management can spin off ~$400-$500 in FCF each rolling 12-month period (Figure 3) reinvesting ~30-40% of NOPAT to maintain its competitive position – it the business returns are high. If not, this will be difficult to maintain. Plus, future earnings trends are a concern. As Buffett said, “the investor of today doesn’t get paid for yesterday’s growth”.
Potential negative catalysts for further downside
From my perspective, several headwinds might compress the future upside for JHBT’s market value in the next 1-3 years. These are related specifically to the business and valuation, namely:
- JBHT produced ~4% average economic profit on its post-tax up until FY’23, when the combination of 1) higher rates, 2) labour costs, 2) labour costs, and 3) generally lower volumes, began to crimp earnings. The earnings trend has since been down from peak NOPAT of ~$1 billion in FY’22 (Figure 3). Operating revenues were $2.94 billion for Q1 FY’24, down 9% YoY. Earnings were down ~35% YoY, well behind consensus. Downsides were underscored by reduced revenue per load and volumes in its JBI and JBT businesses [these are JBHT’s intermodal and truckload segments, respectively]. In my view, this signals a period of difficult business going forward for the company, as 1) more capital must be employed to stay competitive, but 2) it is earnings less on this. It’s like turning the speed up on the treadmill – more energy expenditure, but we aren’t moving anywhere.
Figure 3.
Company filings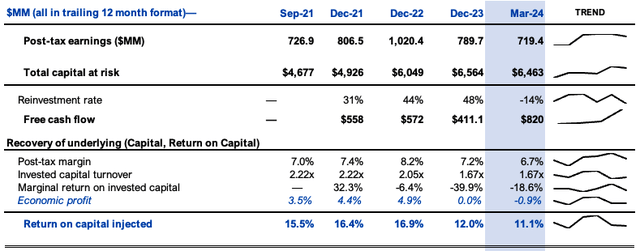
- I am no way criticizing JBHT for 1 quarter of headwind – the trend has been in situ for almost 2 years – in my view, JBHT’s ROIC is an issue because it 1) is below long-term market averages as an opportunity cost and 2) continues a longer-term downtrend that’s been in situ since FY’22. Rates have hurt the company’s debt outstanding balances but the capital structure remains intact [debt/equity was at ~0.32x in FY’21 and remains there today] and interest expense is covered >14x from TTM EBIT. But business continues to be hit by ~300 basis points higher OpEx – up from 8.6% of sales in FY’21 to ~11.4% in Q1 FY’24. Post-tax earnings are down, thus bringing <12% and the stock price with it.
- Business returns are driven by efficiencies and the historical 2x capital turnover [here, each $1 of investment made to the business was rotating $2 in sales] but this is now <1.7x [$1.70 per $1 investment]. The turnover on capital is the key driver to JBHT’s competitive advantage in my view. We see this as, when capital turnover dropped, so too (i) did economic profits, [to -$0.54/share] and (ii) its CAP from ~5 years to zero [Figure 4 and Figure 5 respectively]. My view is there is no advantage period now and that ROICs will continue to fade below our 12% threshold in the medium term, supporting a hold.
Figure 4.
Company filings, author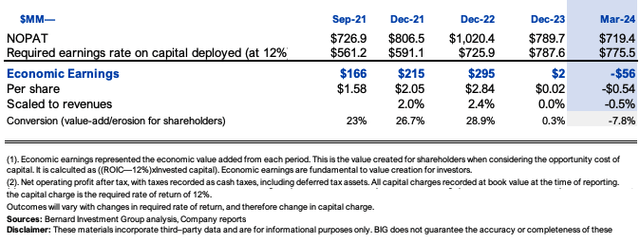
Figure 5.
Author’s estimates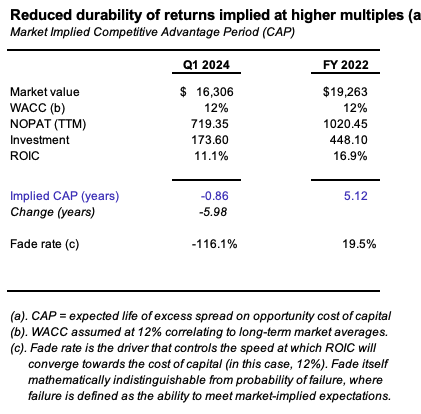
Fully valued, limited scope for expansions
JBHT is fairly valued at current levels in my view given 1) the points discussed above, and 2) the prospect of more permanent multiples contraction.
Specifically, my opinions are that (i) the market looks to have reflected the fade in JHBT’s business returns and revalued it accordingly, and (ii) the future stream of the company’s excess earnings suggests current market values are still too hot. Excess earnings are the spread of NOPAT above the 12% hurdle rate [for instance, a business with $100 capital, must produce >$12 NOPAT each year to meet this criterion].
Valuation insights
- The bulk of JBHT’s valuation is tied up in its current business operations in my view. The commodity multiple of 8.4x represents a business that earns our 12% hurdle rate on capital and therefore assumes no value-add (1/0.12= 8.3x). In FY’23, the market valued its future growth opportunities at ~8.3x, warranting a 16.6x P/NOPAT multiple (Figure 6). The potential for multiple change was low in FY’22 my view, but it is now at risk for a further 0.4x contraction in my view.
Figure 6.
Author’s estimates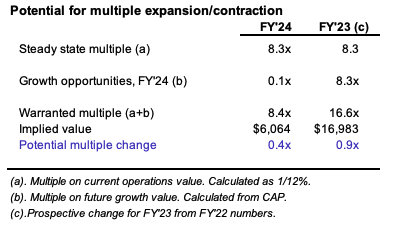
- Investors reflected this in the EV/IC multiple contraction from 3.4x to 2.7x from December last year to the time of writing [see: Figure 7, well below historical range]. This says 1) the value of JBHT’s growth is now compressed, 2) the capital employed is less profitable, and 3) headwinds to price change moving forward. Fact is investors continue to value it at ~24x NOPAT – an increase from ~19x in FY’22. But, earnings are down – so, same multiple of earnings, but a reduced multiple on capital invested in the business. Carrying these forward [which is fair in my view, as the calculus is biased away from our favour] with a generous 23x NOPAT (Figure 8) gets us to ~$175-$180/share on my FY’26E forward estimates [which are located Appendix 1]. The risk/reward calculus is biased to the downside, as seen in Figure 9 – the valuation is all held up by the multiple vs. fundamentals.
Figure 7.
Author, company filings Author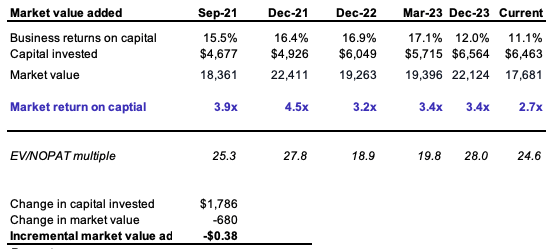
Figure 8.
Author’s estimates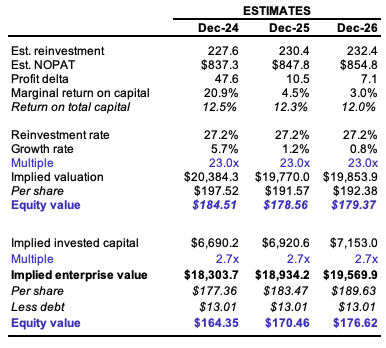
Figure 9. Valuation calculus is negatively skewed as JBHT needs to 1) trade at ~23x EV/NOPAT with 2) ~5% earnings growth to compound here. If it goes -5% to 21.5x, 5% earnings growth gets us to today’s value. Consensus projects ~4% earnings decline this year. If this occurs, even if we stay at ~22-23x, this gets us below current levels. In other words, the embedded expectations are still exquisitely high, despite the change in fundamental value drivers [reduced capital turnover].
Author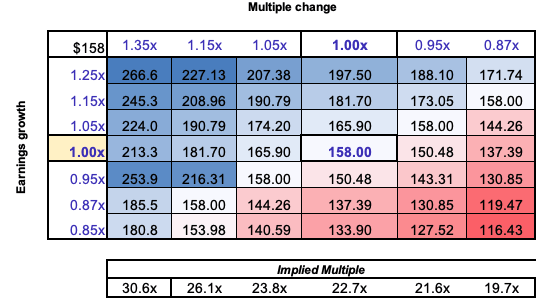
- The future economic profit stream to FY’25 at my estimates discounted at ~12% corroborates a c.$170/share valuation today, supported by 1) the reduced CAP, 2) compressed ROIC and capital turnover, and 3) already stretched valuations. With the combination of (i) FY’24 est. NOPAT growth, (ii) a potential 0.4x change in P/NOPAT multiple, and (iii) forward dividend yield of ~1.1%, the TSR implied is ~3.2% this year, in line with CAGR findings earlier (Figure 11).
Figure 10.
Author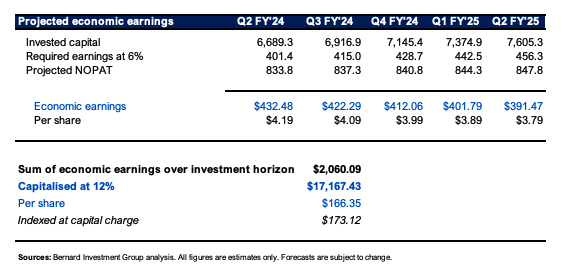
Figure 11.
Author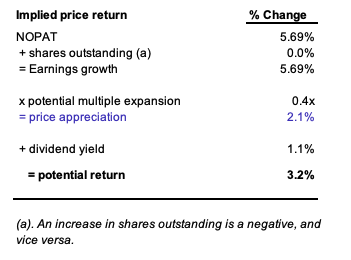
Risks
Upside risks to the thesis include 1) greater than expected earnings growth, 2) much-improved rates/inflation axis, 3) reduction in JBHT’s corporate debt costs, and 4) GDP revisions to US economy.
Downside risks are 1) a further drop in ROIC, 2) sharp drop in sales growth due to weaker demand, 3) the broader set of macro risks that should be factored into all analysis right now.
In short
In my view JBHT’s competitive advantages are in 1) its deep customer networks, 2) highly efficient capital base [including its fleet], and 3) excess earnings above our 12% threshold. However, in my view, these are waning. This is well founded in the economic data and further multiple compression could be on their way if things don’t improve. In my view, the fade in ROIC will continue in the medium term, and JBHT is best viewed from the sidelines from now. Rate hold.
Appendix 1.
Author’s estimates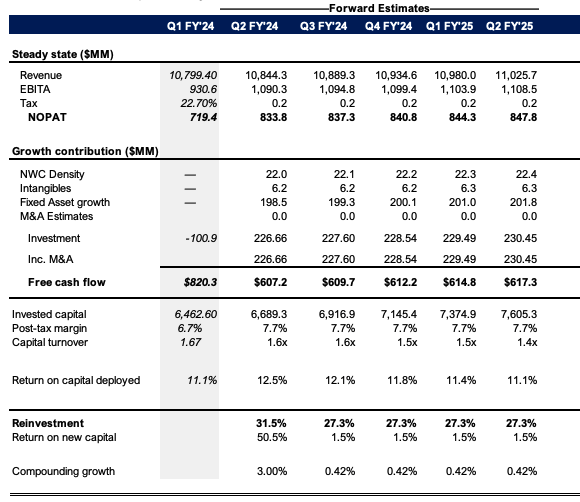
Credit: Source link