
JHVEPhoto
Executive Summary
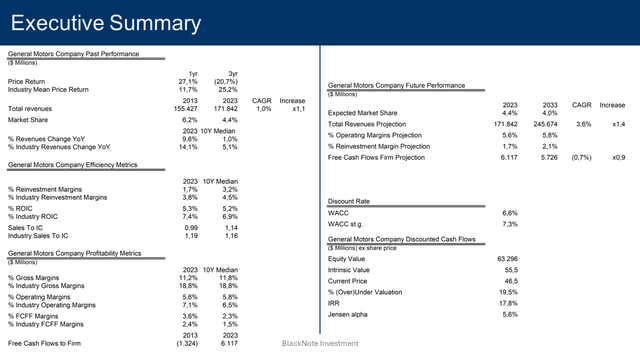
General Motors (NYSE:GM) stocks are currently trading below their fair market price.
We expect GM to shrink its market share in the foreseeable future.
However, thanks to the good profitability, and excellent management of working capital, which led the firm to reduce reinvestment needs and increase free cash flow above the industry average, we expect GM to continue to deliver solid returns to its shareholders in the coming years, despite the lack of growth.
At current prices, our assumptions suggest that GM’s risk-reward profile has the potential to generate a positive excess return (alpha 5.6%).
Source – BlackNote Investment
Revenue Analysis
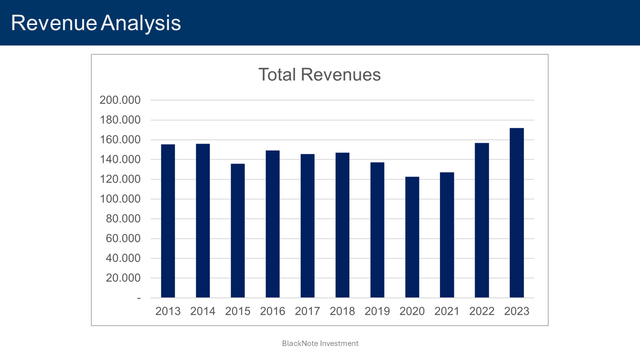
In 2023 GM’s total revenues sat at $171.8 billion, an increase of 9.6%, a worse performance when compared to the y-o-y industry growth rate of 14.1%.
Source – TIKR Terminal
Despite the modest performance of 2023, over the past decade, the company’s median revenue growth rate was equal to 1%, significantly lower than the industry median growth rate of 5.1% for the same period.
As of the 2024 Q1, revenues quarter-on-quarter revenue growth rate continues on a positive trend, registering a 7.6% increase.
Profitability Metrics
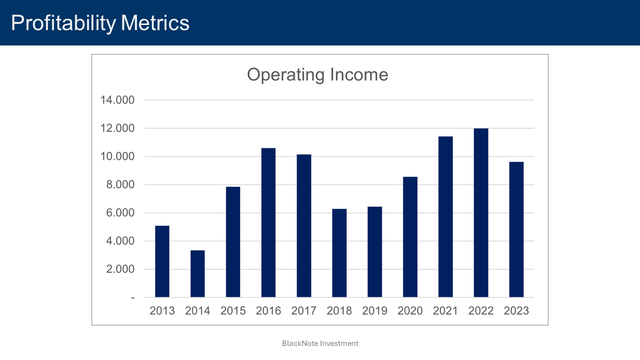
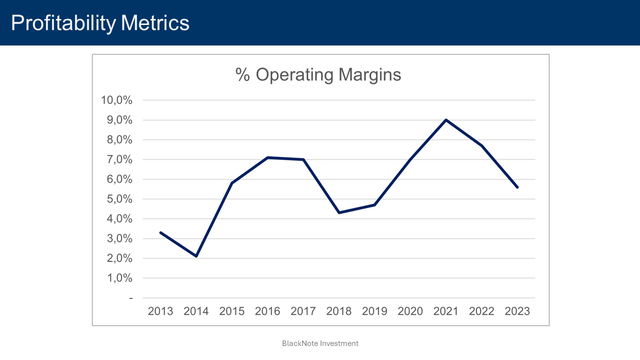
The 2023 GM’s operating margin was 5.6%, worse than the 2023 industry median value of 7.1%. The total operating profit was $9.6 billion, registering a steep decrease of 19.8% y-o-y.
Source – TIKR Terminal
The 10-year median operating margin is equal to 5.8%, again, lower than the industry median value of 6.5% registered over the past decade.
Source – TIKR Terminal
Considering GM’s long-standing position as a legacy automaker, we comfortably expect the firm to maintain an operating margin around its historical median of 5.8% in the coming years.
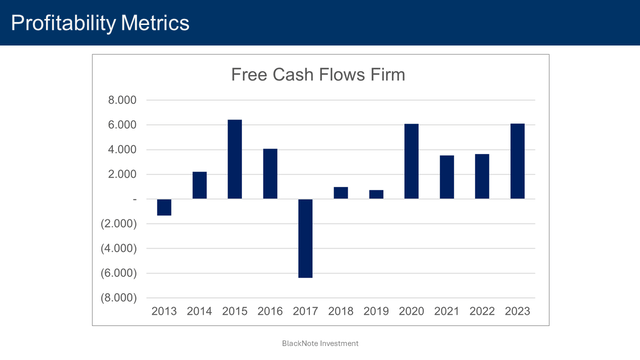
Looking at other measures of profitability, in 2023 the gross margin sat at 11.2%, in line with the median value of 11.8%, while the free cash flow margin was 3.6%, better than the past decade’s median value of 2.3%, and significantly better than the 10-year median industry value of 1.5%.
GM has been able to deliver solid and consistent free cash flows to the firm (FCFF) through the years, equal to $6.1 billion in 2023.
Source – TIKR Terminal
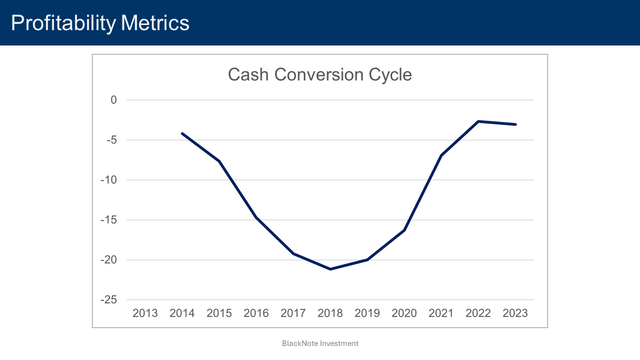
The major contributor to firms’ ability to generate positive cash flows relies upon its excellent working capital management. From 2013 to 2023, GM has repeatedly scored a negative cash conversion cycle (CCC), registering a 10-year median value of negative (11.2) days, while the median value for top automakers sits at 27.3 days.
Source – TIKR Terminal
The CCC ratio is a good metric to compare automakers’ ability to manage working capital as it measures the length of time it takes a firm to turn inventory investments into cash, obtained as average days of outstanding inventory and outstanding receivables minus average days of outstanding payables.
Firms with low CCC ratios have lower reinvestment needs in working capital and, thus higher free cash flows.
A negative CCC ratio implies that GM’s working capital needs are indirectly entirely financed by suppliers, granting them longer payment periods than the period it takes for automakers to sell finished vehicles and collect cash from customers.
Reinvestments & Efficiency Ratios
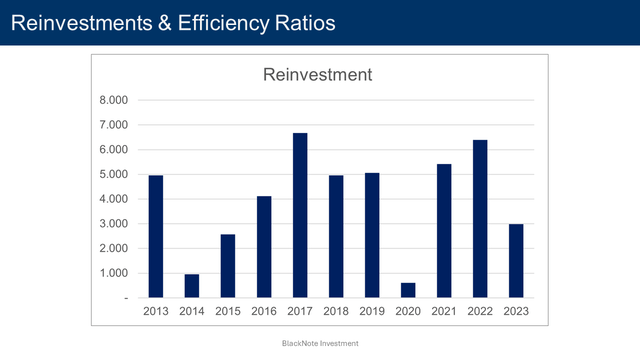
Over the past decade, the median reinvestment margin of GM stands at 3.2%, comprising net capital expenditures, acquisitions, and changes in working capital. When treating R&D expenses as capital expenditures due to their long-term value generation, this figure adjusts to 5.8%.
Source – TIKR Terminal
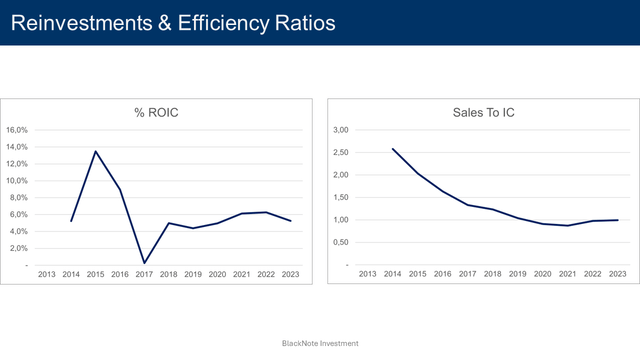
In terms of efficiency, during the period 2013-2023, GM boasts a median ROIC of 5.2% – compared to an industry median value of 6.9% – and a sales to invested capital ratio of 1.14, in line than the industry median value of 1.16.
Source – TIKR Terminal
Financial Ratios
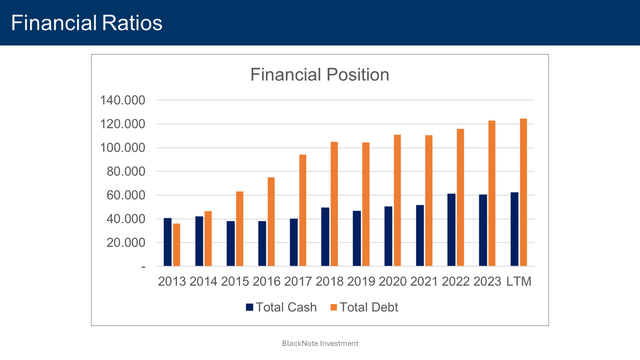
Briefly dwelling on financial ratios as of the most recent reporting period, the net cash position registers a negative value of $62.4 billion.
Source – TIKR Terminal
The interest coverage ratio is stable around its median value of 12. The current ratio and the debt-to-equity ratio instead are sitting at 1.16 and 1.77, respectively – 2013-2023 median values 1.01 and 1.7 respectively.
Market Share and Competitors Analysis
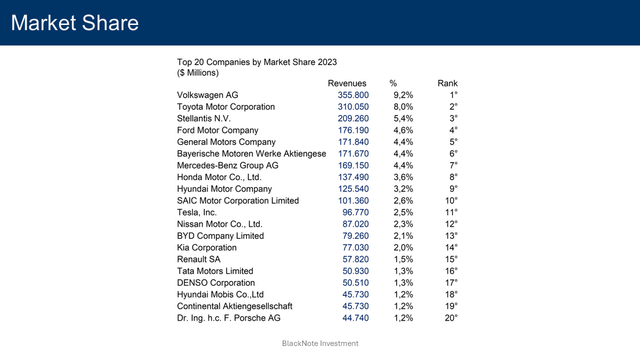
GM, with its $171.8 billion in revenues in 2023, has established a good presence in the automobile industry, placing fifth among the top automakers and representing 4.4% of the industry’s total revenues of $3.86 trillion.
Source – BlackNote Investment
The automobile industry is highly competitive. Looking at the industry in its entirety, primary players consist of Volkswagen with a 9.2% market share, Toyota with an 8% market share, and Ford with a 4.6% market share.
Industry Growth Forecasts
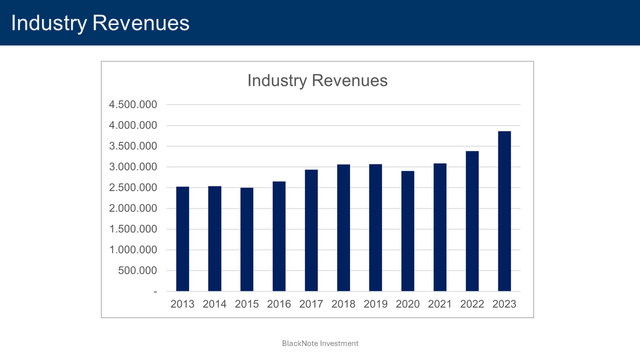
From 2013 to 2023, the industry’s revenues grew at a CAGR of 4.3%, increasing 1.53 times from $2.52 trillion to $3.87 trillion.
Source – BlackNote Investment
Despite lower-than-anticipated electric vehicle adoption rates, which have led legacy automakers to adjust spending, production, and product launches of new energy vehicles (NEVs), it’s clear that NEVs are the future of the automobile industry with automakers that, sooner or later, will be forced by legislators to cease the production of internal combustion engine (ICE) vehicles to promote more sustainable means of transportation.
Other than a secular switch in vehicles’ powering systems, which will boost the sale of new vehicles throughout the next decade, emerging economies – especially Asian ones like Thailand, India, Indonesia, Taiwan, and China for a lesser part – are expected to drive the demand for new cars.
To capitalize on such opportunities, over the past decade, collectively the industry registered a median reinvestment margin of 4.5%, which comprises investments made in capital expenditures, R&D, and acquisitions.
In terms of efficiency and return on investments, the automobile industry median sales to invested capital in the period 2013-2023 is equal to 1.16.
Combining both the reinvestments made through the past decade and the industry’s ability to generate revenues from the investments made, the 2024 expected revenue growth rate for the industry is 5.1%.
The industry’s expected growth rate, and all the related industry assumptions, are based on the 2024 Automobile Industry Outlook published by BlackNote Investment.
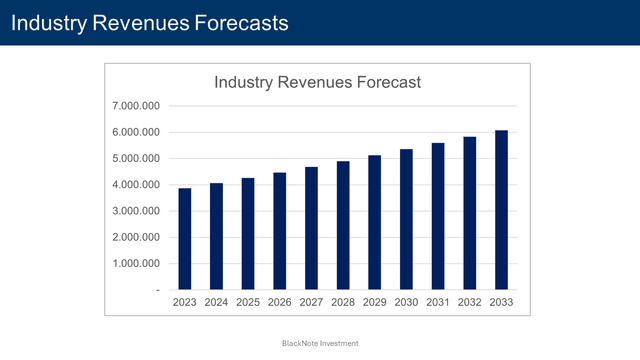
By 2033, the automobile industry revenues are expected to reach $6.07 trillion, increasing 1.57 times from the $3.87 trillion registered in 2023 at a CAGR of 4.6%. We projected the industry’s expected revenues 10 years from now, applying the expected growth rate of 5.1% and allowing it to slowly decline as the industry approaches the economy’s perpetual growth rate, represented in this case by the USD risk-free rate.
Source – BlackNote Investment
Company Growth Forecasts
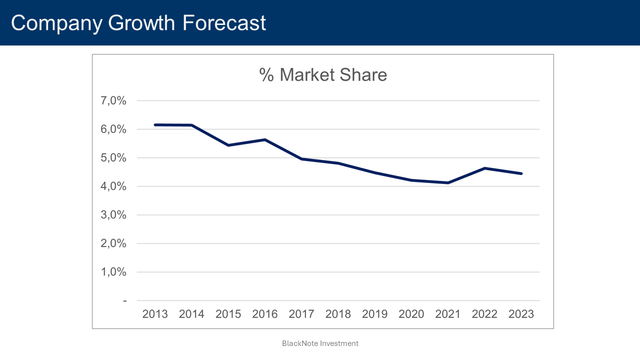
Projecting GM’s future market share, over the period 2013-2023, its revenues grew at a CAGR of 1% increasing 1.1 times from $155.4 billion to $171.8 million/billion, while its market share decreased from 6.2% to 4.4%.
Source – BlackNote Investment
Despite being a legacy automaker, particularly in the US, GM has lost a significant portion of its market share over the past decade due to the increasing competition in the automotive industry, especially as new energy vehicle automakers like Tesla and BYD have undergone a relentless conquest of the market.
As recently reported by GM, the bulk of its sales growth is derived by EVs, with sales up 40% y-o-y.
It’s undeniable that growth opportunities in the automobile industry relies in the EVs segment
However, the greater emphasis on ICEs and hybrid vehicles will benefit GM’s profitability and cash flow generation but will come at the expense of market share as the market inevitably pivots towards full electrification forced by the increasing regulations at both national and international level
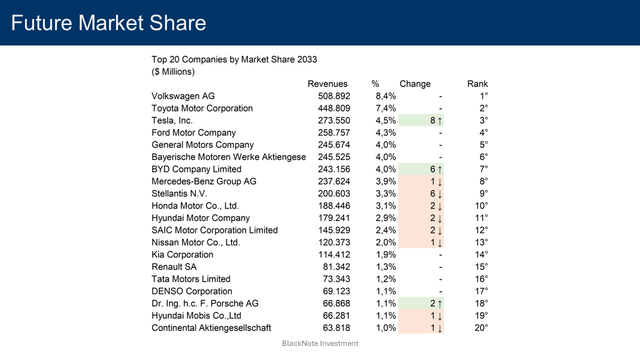
With these assumptions, GM’s market share is expected to decline to 4% by 2033 with revenues projected to reach $245.7 billion by 2033, representing an increase of 1.4 times from the 2023 revenues of $171.8 billion at a CAGR of 3.2%.
Source – BlackNote Investment
Free Cash Flows Forecasts
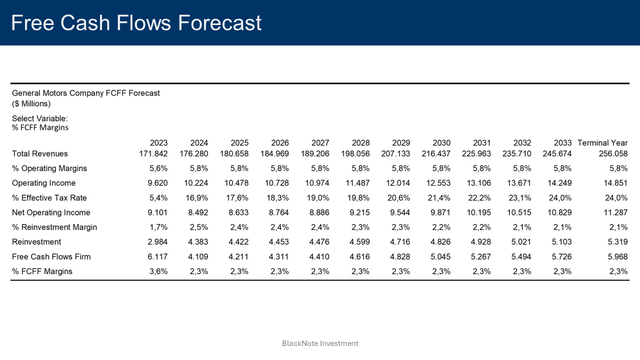
Moving on to projecting future cash flows, we expected GM to maintain better than industrial average cash flow generation, with the FCFF margins remaining around its median value of 2.3%, delivering solid and consistent free cash flows to its shareholders.
Synthesising all underlying assumptions and strategic directions – $245.6 billion in revenues by 2033, 5.8% operating margin, and FCFF margin around 2.3% – GM’s free cash flows to the firm are anticipated to swell to $5.7 billion by 2033.
Source – BlackNote Investment
Valuation
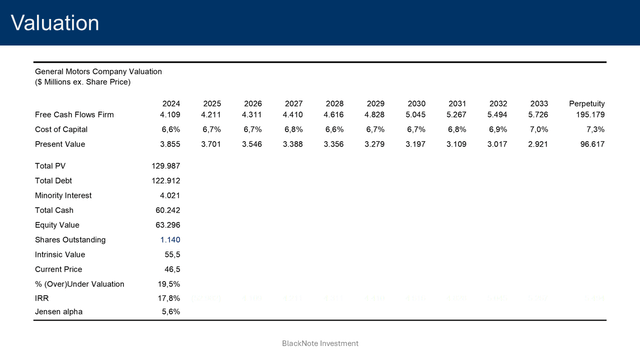
Applying a discount rate of 6.6% in normal growth, and a discount rate of 7.3% in perpetuity, we obtain that the present value of these cash flows – after adjusting for debt and cash on hand – is equal to $63.3 billion or $55.5 per share.
Compared to the current prices, GM stocks are undervalued by 19.5%.
To justify current stock prices, the implied rate of return would be equal to 17.8%.
It implies investing in GM at the current prices would deliver a positive alpha of 5.6% as it would generate higher returns compared to the actual return investors should expect given the assumption on cash flows and risk made so far, based on GM’s cost of equity of 12.2%.
Source – BlackNote Investment
The street target for GM – based on 28 different analyst expectations – is sitting at $56.8 per share, as of the 1st of July 2024, with 14 street recommendations expressing the rating “Buy”.
Discount Rate
To determine the appropriate discount rate, we employ the WACC method, which considers both the cost of equity and the cost of debt.
The cost of equity – 12.2% – is derived using the USA equity risk premium of 4.6% – as of June 2024 – the current USD risk-free rate of 4.2%, and the company’s levered beta of 1.75. The company’s beta is based on the automobile industry’s unlevered beta of 0.65.
The cost of debt – 4.9% – represents the expected return demanded by debt holders and is influenced by the company’s specific risk profile and the broader market conditions. It is computed considering the current USD risk-free rate of 4.2%, the company’s default spread of 0.7%, and the USA default spread of 0%.
With a current Equity to Enterprise Value of 33.6% and a Debt to Enterprise Value of 66.4%, GM’s discount rate in normal growth is 6.6%.
As GM enters the steady state, both the company’s beta and company default spread are expected to approach the industry’s median values of 0.82 and 0.7%, respectively.
Mature companies often have more predictable cash flows and may change their financing strategies. We anticipate GM to adjust its Equity to Enterprise Value and Debt to Enterprise Value towards the industry median of 83.4% and 16.6%, respectively, reflecting a more typical capital structure for a stable company.
With these assumptions, the discount rate used to discount the cash flows in perpetuity is 7.3%.
Conclusion
Despite the lack of growth, thanks to the good profitability, and excellent management of working capital, GM is poised to continue to deliver solid returns to its shareholders in the coming years.
In conclusion, at current prices, our assumptions suggest that GM’s risk-reward profile has the potential to generate a solid positive return considering the 5.6% alpha, representing a good investment opportunity.
Credit: Source link