

andreswd
Introduction
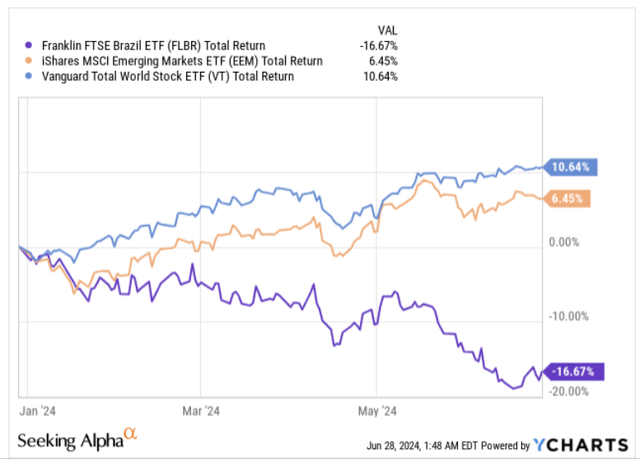
The Franklin FTSE Brazil ETF (NYSEARCA:FLBR), a $158m-sized ETF that offers a cost-competitive route to a portfolio of 85 Brazilian stocks, hasn’t fared too well in 2024; this year while global stocks have generated double-digit returns, and emerging markets have notched up gains of over 6%, FLBR has lost its way, declining by close to -17%!
YCharts
Back in February, we had actually written an article on FLBR, but we weren’t convinced it was going to be a rewarding BUY for investors and had advised them to wait on the sidelines.
Now, with the risk-reward in a better place, and some green shoots in a few key metrics, we are prepared to turn more constructive on FLBR and are revising our rating to a BUY. Here’s some of the underlying commentary supporting our positive stance on FLBR.
Improving Macros
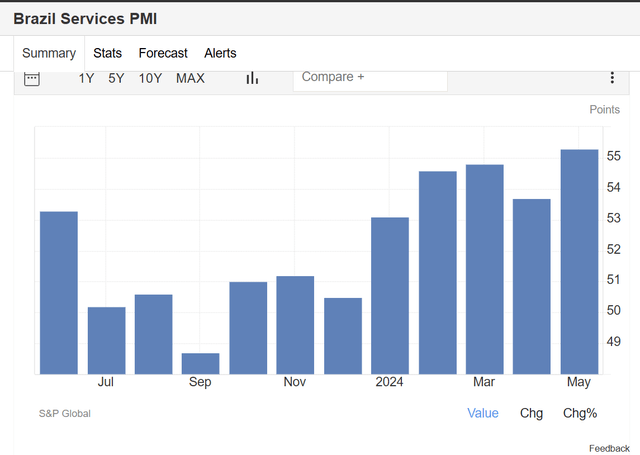
The last time we touched upon the Brazilian landscape, we had highlighted our concerns over how the services sector, which accounts for 60% of the economy’s GDP was witnessing some slowdown.
Trading Economics
However, the most recent services PMI number of 55.3 was very healthy, marking its highest reading in almost two years! This terrain appears to be benefitting from a recovery in demand, which has triggered business confidence and employment conditions.
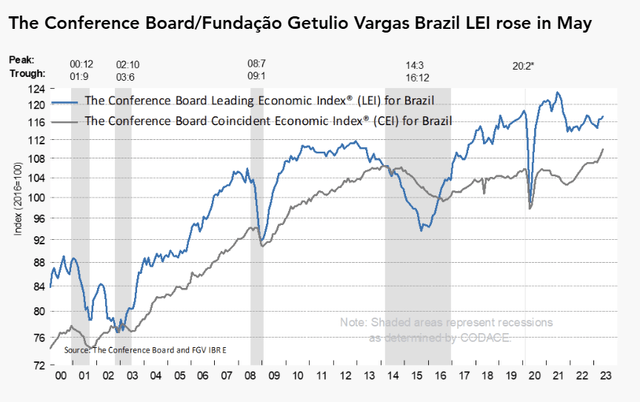
The improvement on the services front, has also left a positive mark on the leading economic index (LEI) of Brazil, which is also a function of six other macro-economic variables (including manufacturing expectations, consumer expectations, export and durable good conditions, etc.). Note that the LEI is a good measure of picking up significant turning points in the business cycle in advance. For context, after a flat April, the most recent reading in May rose by 0.4%.
Conference Board
Then the recent inflation report which came out a couple of days back surprised the street, coming in at only 0.39% vs the figure of 0.44% last month. For context, the street was expecting a similar figure as last month’s. It’s too early to say if this will change the thinking of the Brazilian central bank, who last week, had signaled that it would be pausing their rate easing stance for 2024 with the Selic expected to remain at 10.5% for the year. Having said that, investors should be aware that employment conditions still remain quite robust, with the number of working people hitting record highs of 100.8m. This bodes well for future income and consumer spending trends. Even otherwise, court-mandated compensation payments and higher social benefits under the Lula government are providing support for underlying spending. All in all it’s worth noting that the Brazilian Finance Ministry hiked its GDP forecast for the full year from previous expectations of 2.2% (March estimate) to 2.5%.
Solid Enough Yield
YCharts
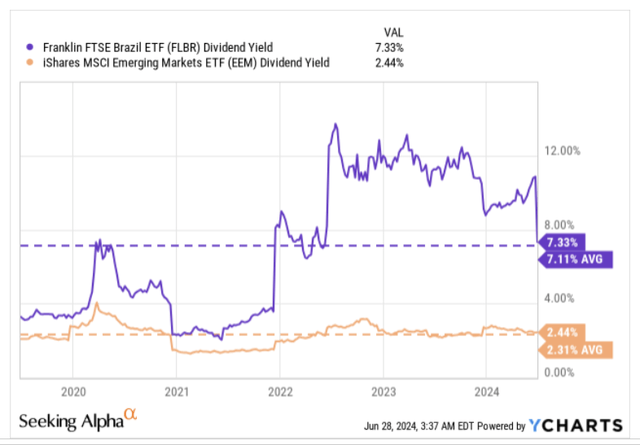
Long-standing holders of FLBR may have been left disappointed with the recent semi-annual distribution of $0.5228 per share in June which was 54% lower than what it was a year ago, and 49% lower than what it was two years ago. Yet, the overall yield of 7.33% is still around 22bps better than what it has averaged over the past five years. Also consider the vast differential in yield relative to the iShares Emerging Markets ETF, which works out to almost 500bps!
Compelling Earnings Potential At Low Valuations
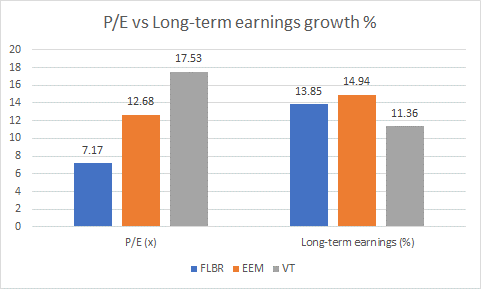
What’s also driving our now bullish stance on FLBR is the extremely compelling tradeoff on valuations and earnings. Note that FLBR’s portfolio of Brazilian stocks can be picked up at a cut-price P/E of just over 7x; contrast that with the respective P/Es of emerging markets in general or global stocks both of whom trade at significantly higher premiums of 77% and 144% respectively.
Morningstar
Typically low P/E investment products are usually also associated with low earnings growth, but that isn’t quite the case with FLBR whose holdings are poised to deliver weighted average long-term earnings growth that is almost 2x as much as its P/E. This is even more than global stocks who are only poised to deliver earnings of 11.4%.
Closing Thoughts- Attractive Risk-Reward On The Charts
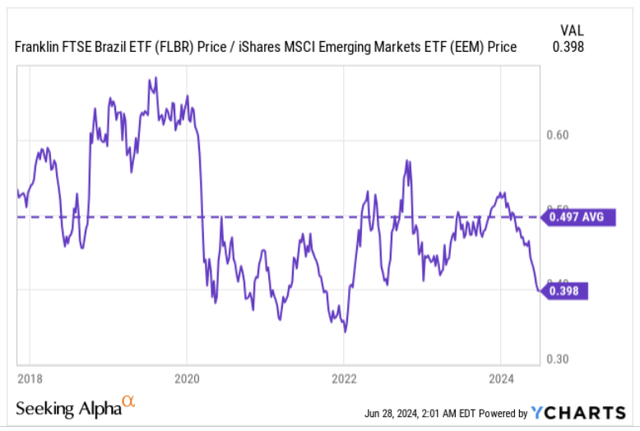
The chart below suggests that investors looking for beaten-down pockets in the emerging market space that could potentially mean-revert, may likely gravitate to Brazilian stocks. Basically, FLBR’s relative strength ratio, versus a diversified pool of EM stocks, is now trading around 20% lower than its long-term average.
YCharts
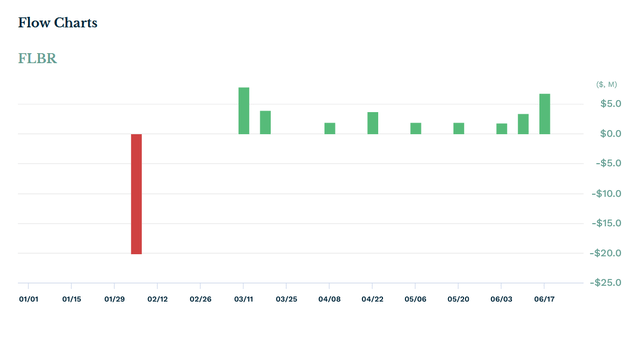
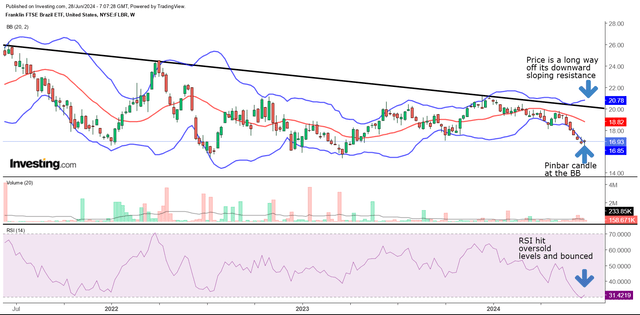
Recent developments on FLBR’s weekly chart also suggest a long position now wouldn’t be a bad choice. Even though we still have one day’s worth of price action yet to be completed, it looks like this week will likely close with a hammer candle at the lower Bollinger band boundary; given that this is two standard deviations away from the 20-period moving average, it suggests that the selling has gone overboard; that’s why we’ve likely seen the hammer candle, which typically points to some bargain hunting support. Interestingly enough, the fund flow chart suggests that buying in FLBR has recently hit 14-week highs.
ETF.com
Also note that the RSI had dropped to oversold levels and pivoted from there. Meanwhile, the price is also a long way from its upward-sloping resistance, giving investors a nice runway ahead.
Investing
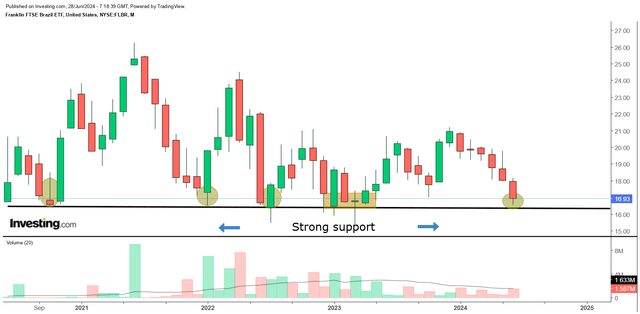
If you want to take a bird’s eye view of things, you may also look at the monthly chart of FLBR, where the ETF has now fallen to levels that have previously worked as reliable areas of support. This provides further confidence for undertaking a long position in the fund.
Investing
Credit: Source link