

amanalang/iStock via Getty Images
Today’s article is supposed to offer an update on the Global X Adaptive U.S. Factor ETF (NYSEARCA:AUSF), a fund that leverages a sophisticated factor-rotation approach. My initial assessment presented in March this year was lukewarm, with the main reason for that being its rather disappointing performance. For clarity, today’s note is not introducing a rating upgrade, as returns remain well short of desirable. Another reason for skepticism is AUSF’s factor mix, which, as per my analysis, is dominated by low volatility and value, something I believe has little chance, if any, of maximizing returns in the present market environment.
What is the idea at the crux of AUSF?
As we know from the documents available on the Global X website, AUSF is a passively managed vehicle, with the Adaptive Wealth Strategies U.S. Factor Index being the cornerstone of its strategy. The index itself is an amalgamation of at least two of the three sub-indices, namely
- the Solactive U.S. Large & Mid Cap Value 100 Index TR,
- the Solactive U.S. Large & Mid Cap Momentum 100 Index TR,
- and the Solactive U.S. Large & Mid Cap Minimum Downside Volatility 100 Index TR,
with the proportions contingent on their returns. According to the fact sheet:
AUSF either allocates to two factors with a 50% / 50% weighting, or all three factors with a weighting of 40% / 40% / 20% depending on the trailing returns of each factor.
Regarding the adjustment schedule, the index methodology summary says that
The composition of the Index is adjusted quarterly on the first Wednesday in February, May, August, and November.
AUSF returns: underperformance persists
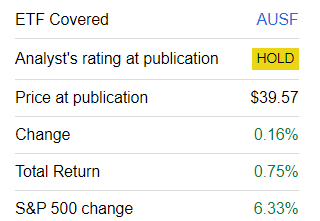
In short, I am mostly disappointed by AUSF. One of the reasons is that since my previous assessment presented on March 18, it has significantly underperformed the S&P 500 index.
Seeking Alpha
It is somewhat confusing that AUSF trailed IVV even in April this year despite low beta of its portfolio (weighted-average 24-month beta of 0.79 as of March 17). The issue here is that April was a mostly challenging month for stocks as investors were mulling over the fate of the long-duration equities rally amid bearish inflation data. So less volatile portfolios mostly did better than the S&P 500 during that sluggish period. To corroborate, below are the returns delivered by a few ETFs that target the low volatility factor:
| ETF | April 2024 return |
| AUSF | -4.62% |
| IVV | -4.05% |
| iShares MSCI USA Min Vol Factor ETF (USMV) | -3.74% |
| Franklin U.S. Low Volatility High Dividend ETF (LVHD) | -2.69% |
| Invesco S&P 500 Low Volatility ETF (SPLV) | -3.13% |
Data from Portfolio Visualizer
As we know from its website, AUSF
seeks to outperform traditional market capitalization weighted indexes by allocating across three factors – minimum volatility, value, and momentum – that have historically demonstrated advantages compared to broad benchmark indexes.
However, over the September 2018–May 2024 period (it was incepted in August 2018), AUSF delivered an annualized return 1.2% lower than that of IVV, with the main reason for that being its small upside capture.
| Metric | AUSF | IVV |
| Start Balance | $10,000 | $10,000 |
| End Balance | $18,844 | $20,035 |
| CAGR | 11.65% | 12.85% |
| Standard Deviation | 19.42% | 18.39% |
| Best Year | 27.45% | 31.25% |
| Worst Year | -10.63% | -18.16% |
| Maximum Drawdown | -31.57% | -23.93% |
| Sharpe Ratio | 0.56 | 0.64 |
| Sortino Ratio | 0.81 | 0.97 |
| Upside Capture | 86.13% | 100.42% |
| Downside Capture | 83.86% | 96.55% |
Data from Portfolio Visualizer
Nevertheless, in defense of AUSF, it is still worth remarking that the picture was a bit brighter over other periods, mostly because the ETF delivered solid performance during the 2022 bear market. Let us review the October 2020–May 2024 period, which was selected because the Fidelity U.S. Multifactor ETF (FLRG) was incepted in September 2020.
| Metric | AUSF | IVV | VFMF | OMFL | FLRG |
| Start Balance | $10,000 | $10,000 | $10,000 | $10,000 | $10,000 |
| End Balance | $19,700 | $16,624 | $18,676 | $18,333 | $16,425 |
| CAGR | 20.31% | 14.87% | 18.57% | 17.97% | 14.49% |
| Standard Deviation | 15.88% | 17.41% | 18.80% | 20.12% | 15.60% |
| Best Year | 27.45% | 28.76% | 29.61% | 29.12% | 28.92% |
| Worst Year | -0.78% | -18.16% | -5.66% | -13.97% | -10.98% |
| Maximum Drawdown | -10.19% | -23.93% | -16.78% | -22.11% | -18.99% |
| Sharpe Ratio | 1.09 | 0.75 | 0.87 | 0.8 | 0.79 |
| Sortino Ratio | 2.27 | 1.2 | 1.58 | 1.47 | 1.31 |
| Upside Capture | 89.22% | 101.86% | 95.85% | 106.63% | 89.77% |
| Downside Capture | 58.37% | 97.86% | 74.86% | 91.51% | 83.43% |
Data from Portfolio Visualizer
Over that timeframe, AUSF beat IVV as well as a few peers that leverage multi-factor strategies, including the Vanguard U.S. Multifactor ETF (VFMF), the Invesco Russell 1000 Dynamic Multifactor ETF (OMFL), and FLRG.
But with 2022 removed, AUSF’s returns again look rather weak, as it trailed IVV by more than 5% as equities were recovering from the sell-off. Anyway, it did better than the selected peers over the period concerned.
| Metric | AUSF | IVV | VFMF | FLRG | OMFL |
| Start Balance | $10,000 | $10,000 | $10,000 | $10,000 | $10,000 |
| End Balance | $13,268 | $14,061 | $12,929 | $13,086 | $12,798 |
| CAGR | 22.09% | 27.20% | 19.88% | 20.91% | 19.02% |
| Standard Deviation | 15.44% | 13.94% | 16.97% | 12.25% | 18.72% |
| Best Year | 22.23% | 26.32% | 18.53% | 18.33% | 21.52% |
| Worst Year | 8.55% | 11.31% | 9.07% | 10.60% | 5.31% |
| Maximum Drawdown | -5.39% | -8.32% | -8.92% | -5.78% | -12.94% |
| Sharpe Ratio | 1.05 | 1.44 | 0.85 | 1.2 | 0.75 |
| Sortino Ratio | 2.16 | 2.93 | 1.69 | 2.18 | 1.35 |
| Upside Capture | 81.49% | 101% | 83.62% | 78.53% | 96.98% |
| Downside Capture | 79.3% | 93.88% | 99.74% | 79.73% | 137.38% |
Data from Portfolio Visualizer. The period assessed is January 2023–May 2024
AUSF factor mix: what has changed?
Since March 15, AUSF has replaced about 13.4% of its portfolio. As of June 20, there were 191 stocks in its portfolio, compared to 192 as of the previous assessment. Among the most notable stocks that were ousted were PNM Resources (PNM), Tapestry (TPR), and Advance Auto Parts (AAP), together accounting for 2.7%. Among the companies AUSF welcomed are The GAP (GPS), Texas Instruments (TXN), and KB Home (KBH), with a combined weight of 1.7%. As a consequence, AUSF’s sector mix has changed slightly. More specifically, financials remained the key sector as they gained 3.2%, now accounting for 26.4% of the net assets. Industrials added 2.5%, proceeding from 6th place to 4th. In contrast, consumer discretionary allocation is now 2.6% lower than in March, as the sector now accounts for 6.5% of the portfolio. Also, exposure to utilities was trimmed by 1.5%, so the sector now has a diminutive 40 bps weight.
Despite the recalibration, AUSF’s portfolio is still dominated by comparatively high-quality value stocks, mostly with low beta coefficients.
Value exposure
As of June 21, the weighted-average market cap of the ETF’s portfolio stood at $104.3 billion, as my calculations show. This is about $9.2 billion higher than in March. Despite that, its earnings yield has improved, now standing at approximately 7.1% vs. 6.6% in March. The financial sector remains the essential contributor to that figure, with its average EY being as high as 9.9%, followed by 8.3% of the consumer discretionary sector. Besides, the share of companies with a B- Quant Valuation rating or higher has reached 37.7% vs. 36.6% in March.
Growth factor
With a value tilt, AUSF’s portfolio remains growth-light, though my calculations show that the weighted-average forward growth rates have advanced a little. For example, the WA forward EPS growth rate has reached 6.2%, compared to 5.2% in March. One of the drivers is that fewer companies are now forecast to deliver earnings declines going forward. Besides, the forward revenue growth rate inched to 4% from 3.6%. Nevertheless, I am of the opinion that to succeed in the current market environment, a portfolio should have both growth rates in double digits at a minimum.
Quality
Quality is mostly robust, as illustrated by the 87.3% allocation to stocks with a B- Quant Profitability rating or better. This is an improvement from the 84.5% level seen in March.
Nevertheless, there is still something to dislike on the capital efficiency front, as financials again detract from the Return on Assets, which stands at 6.5%, almost unchanged from the March level. In most cases, I consider ROA below 10% an unsatisfying result.
At the same time, the adjusted Return on Equity (figures above 100% and below 0% were removed to make it look more realistic and to smooth the impact of the over-leveraged companies on the final result) improved a bit, from 17.2% to 17.7%.
Low volatility
The AUSF portfolio is still dominated by stocks with 24-month and 60-month beta coefficients below 1. As a consequence, the weighted-average coefficients stand at 0.79 and 0.95, respectively.
Investor takeaway
In sum, AUSF offers a dynamic portfolio that increases or decreases exposure to value, momentum, and low-volatility factors contingent on the returns of the respective indices. In the current iteration, this is a mostly large-cap portfolio offering a healthy but not perfect quality, adequate value exposure, low beta, and fairly soft growth. The expense ratio is modest at 27 bps.
I am mostly pessimistic about AUSF’s factor-rotation method, as it has been unable to consistently outmaneuver the market since inception, even though it had an edge over certain peers over shorter periods. As I have already said in the previous note, 2022 was a bright spot, yet as the data suggest, AUSF has been incapable of capturing adequate upside during the bull market. Also, the growth characteristics of its portfolio are rather muted, which is a disadvantage. All in all, a rating upgrade is unjustified.
Credit: Source link