

Sofiia Tiuleneva
Investment Thesis
National Beverage Corp. (NASDAQ:FIZZ) is a company that operates in the beverage sector. The company controls brands that produce drinks such as sparkling waters, energy drinks, and juices.
The company has a history of positive results and has distributed special dividends to its shareholders over the years. It recently (12 June) declared a special dividend of $3.25 per share.
Despite the excellent financials, in my opinion, the company does not have the main objective of significantly increasing sales or expanding its business, but rather prefers to focus on the existing products and ESG values. Looking at the revenues and cash flows, we notice that there is almost no growth trend and furthermore, there are no future projects that could make me think of significant increase in sales.
Currently, I believe the stock is slightly overvalued and therefore my advice is to SELL.
Company’s latest 10-Q and stock overview
Net Sales (Company’s 10-Q)
Observing the result of operation in the last 10-Q published by the company on 7th March, we notice a slight increase in net sales in the last three months of 2024. But if we look at the nine months ended, we notice an increase in gross profit of 8%. This could make one think that the company is increasing its gross profit, but in reality, if we look at the 2022 data, we notice that the gross profit was $320.05 million, which is practically identical to the current figure. Even if sales have slightly increased, marketing and distribution expenses do not allow the company to acquire a greater gross profit.
Net Sales 2022 (Company’s 10-Q)
Currently, the strategy of the company consists of brand growth, focusing on developing innovative flavors and sugar-free drinks. National Beverage Corp. seems to put a lot of effort into the LaCroix brand and recently, it has announced the release of a new Mojito flavor.
Our newest LaCroix flavor, Mojito, brings the sensory feel of paradise directly to consumers nationally and other imaginative flavors are currently being presented to major customers. LaCroix remains as one of ‘The Most Trusted Brands in America’ as it continues its leadership in innovation
I think that innovating and creating new flavors, and focusing on healthy drinks, is a good strategy for brand improvement. But I believe that this is not sufficient to significantly increase sales because the new products will have the potential to substitute the existing products, and it’s unlikely that they will attract a significant number of new customers.
In addition to that, a recent report shows that the demand for beverages in the U.S. is decreasing, with the exception of energy drinks, which represent just a part of the portfolio of products offered by National Beverage Corp.
To conclude, we can look at the plot below in which I compare the stock time series with the time series of the S&P500 during the last years.
Stock (yFinance)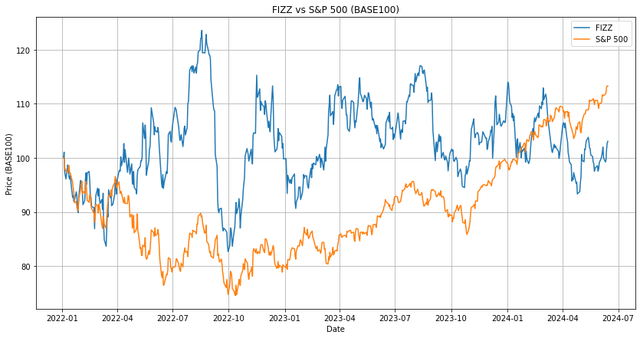
We can easily see that, especially in the last period, the stock price seems to be frozen when it is compared to S&P500.
FIZZ special dividend
On June 12, National Beverage declared a special dividend of $3.25 per share. The ex-dividend date is June 24, 2024, and the payment date will be on or before July 24, 2024.
Now, considering that as of today, there are 94 million outstanding shares, this operation will cost the company approximately $292.5 million.
As we’ll see later, the company in January had $277 million in cash and cash equivalents. This means that these dividend payments will be completely covered by the liquid resources that the company has.
This is not the first time that FIZZ has declared a special dividend. In fact, looking at the dividend history:
Dividends (Seeking Alpha)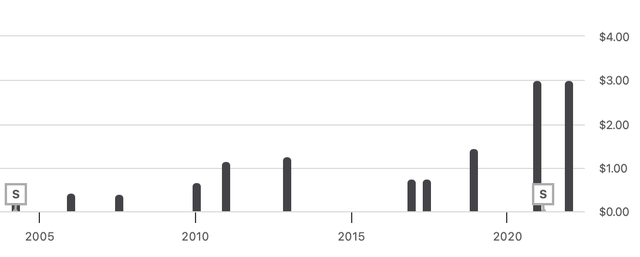
We see that over the years, the company has paid a total of $16.53 per share in dividends.
Now, the problem is that special dividends are difficult to predict since their payment frequency can change over time. As we see from the history chart, it seems that in recent years, the company has increased both the frequency and the amount of dividends.
If we consider that to pay this new special dividend, the company will use almost all of its working capital, I do not expect another special dividend next year. If the company is able to generate the same amount of cash flows in the next years, I’m expecting another special dividend in 2026 or 2027. So, even if you are a dividend investor, maybe it would be better to consider a company that pays dividends on a regular basis to have more control on the investment strategy.
Financial Analysis
Now, let’s look at some financial information about FIZZ.
Balance Sheet (Seeking Alpha)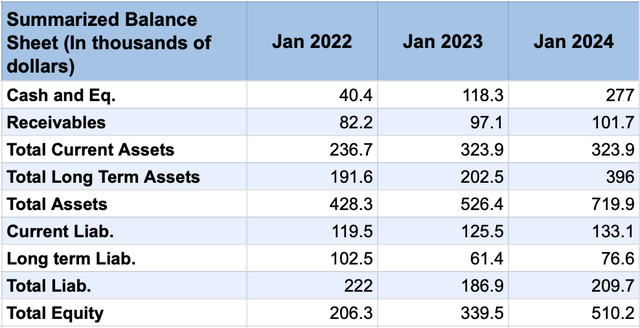
As we can see, cash and cash equivalents have increased from $40.5 million to $277 million during the last 3 years with a CAGR of 89%. This data, in my opinion, summarizes well the conservative approach of this company. Even if FIZZ has the ability to generate cash flows and to accumulate working capital through the years, the management seems to prefer distributing these resources to the shareholders using special dividends instead of investing them in some new projects.
The conservative approach has the positive effect of enforcing the stability of this company from a solvency point of view, and this is confirmed by the table below.
Solvency (Seeking Alpha)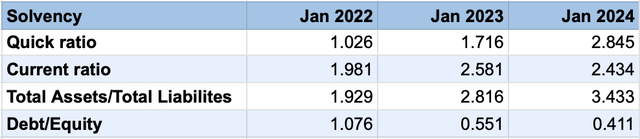
Looking at the latest data available, we see a progression of the main solvency ratios. In January 2024, the Quick Ratio was 2.8, which is really high. It’s hard to find a company with a Quick Ratio above 2. This obviously is given by the fact that the current liabilities of the company tend to remain stable over time, but the liquid assets have increased a lot, as we have seen before.
Now, let’s look at the Income Statement to assess the ability of the company to create value.
Income Statement (Company’s 10-Q)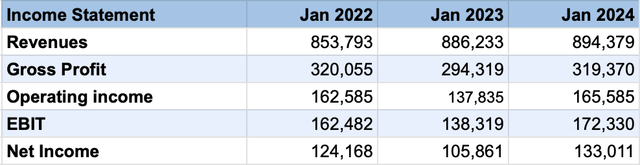
Since the last annual report shows the data up to April 2023, I have considered the nine-month-ended revenues data from the company’s 10-Qs. In this way, we can look at the most recent data.
As we can see, even if the revenues show a slow growth, passing from $853 million to $894 million in the last 3 years, the Gross Profit and the Net Income do not register a strong trend. In my view, a company with that much working capital and those solvency ratios should take more risks and try to invest in some new big projects to increase the Revenues.
In the table below, we can see the main profitability ratios.
Profitability (Author’s calculation)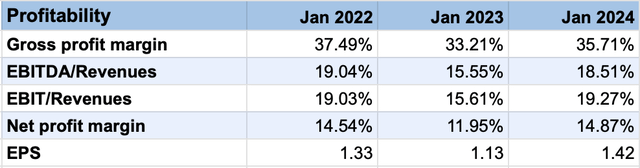
Valuation Shows that the stock does not value the risk
In order to evaluate this company, I wanted to use the Discounted Cash Flows Model.
Starting from the past cash flows data, we observe the same behavior that we noticed earlier with revenues and net income.
Cash Flows (Seeking Alpha) Cash Flows table (Seeking Alpha)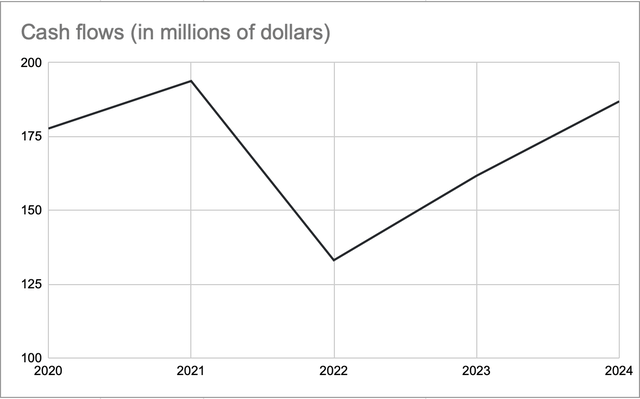

We do not see a strong growth trend in this data. In fact, if we compute the CAGR from 2020 to 2024, we get a compounded annual growth rate of just 1%.
According to the capital asset pricing model, the estimated WACC for FIZZ is 7.6%:
WACC (Alpha Spread)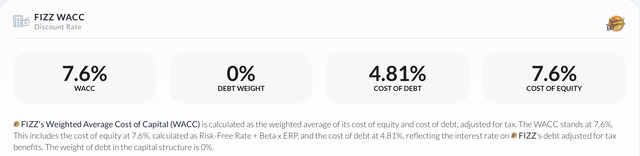
Valuation – 1% growth rate (Author’s calculation)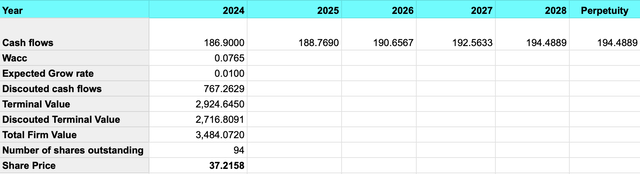
As we can see, using the Discounted Cash Flows Model and assuming a future growth rate of 1%, we get a total firm value of 3.48 billion dollars. Considering that FIZZ has a total number of outstanding shares equal to 94 million, we get a share price of $37.2.
Even if we assume a less conservative approach leading a growth rate of 2%, we get a share price of $44.
Valuation – 2% growth rate (Author’s calculation)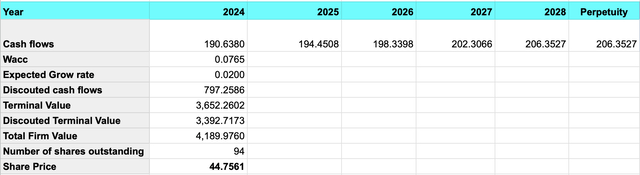
At the time of writing this article, the stock was trading at around $49, showing that it appears to be overvalued. Taking into account the fact that the company is not planning to run some “game-changing” project, I think that the investment does not justify the risk.
Upside risks
The main risk that could lead to a price increase, in my opinion, lies in the fact that the company currently does not have any type of financial concern. As we have seen previously, the company controls costs very well. This means that if in the future National Beverage records a significant increase in sales, this would have a rapid effect on cash flows. In fact, the company’s consistent profitability means that any increase in sales would directly lead to an immediate boost in cash flows. This would obviously lead to an increase in the value of the company and therefore also in the stock price.
Consumer tastes in this case are very difficult to predict, as these types of drinks are not only consumed for the flavor but also for the brand. A particularly effective marketing campaign could lead to one of these brands becoming viral, especially during the summer, and therefore the company could see a significant increase in sales. Finally, it must also be kept in mind that National Beverage controls particularly important brands, such as Faygo, which was founded in 1907.
Conclusions
National Beverage Corp. is an interesting company with a good portfolio of products that covers the demand of different types of customers. The company also shows stable performance and in the last period, it has never registered a negative net income. In addition to that, National Beverage’s finances are really strong, particularly concerning short-term solvency.
Observing the company’s payout strategy, we understand that National Beverage prefers to pay shareholders through special dividends instead of using its cash to invest in some long-term big project to increase sales.
Valuation based on cash flows suggests that the stock is overvalued and, considering all of the factors examined in the article, my advice is to sell as the investment does not justify the risk.
Credit: Source link