

Monty Rakusen
The bull market underway has been characterized by the leadership of mega-caps stocks. In this context, funds with investment strategies focused on these larger companies remain in the spotlight.
One such investment available following this approach is the Vanguard Mega Cap ETF (NYSEARCA:MGC), a market cap-weighted fund focused on the top 200 large capitalization U.S. companies, which has consistently outpaced the S&P 500 over time. MGC also shows a price-to-earnings ratio similar to the S&P 500 or Russell 1000 indexes, while its allocation to larger and highly profitable companies gives MGC’s portfolio a tilt toward quality.
Overall, MGC is an ETF worth keeping in the portfolio as an alternative to gain exposure to the broader market, while looking to outperform the S&P 500 in the long run, as has been the case over the past years.
ETF Description & Highlights
MGC is an exchange-traded fund that tracks the CRSP US Mega Cap Index. This index measures the performance of the largest U.S. companies, aiming to include the top 70% of investable market capitalization. The selected stocks are weighted according to their market capitalization to construct the index., which is then rebalanced quarterly.
The outcome is a relatively concentrated index, with nearly 200 constituents and an average market cap of $417 billion, substantially higher than the $302 billion average for the S&P 500 index, represented by the SPDR S&P 500 ETF (SPY). Consequently, MGC’s stock composition has a much higher allocation to large and mega caps, comprising 96% of total assets, compared to 82% for the S&P 500 index.
MGC’s top ten holdings (Microsoft, Apple, NVIDIA, Amazon, Alphabet Classes A and C, Meta, Berkshire, Eli Lilly, and Broadcom) represent roughly 39% of total assets. These are the same mega caps, mostly from technology and communication services, that also constitute the S&P 500’s top holdings. Similarly to the S&P 500, the CRSP US Mega Cap Index has a low turnover rate of only 2%, giving MGC a relatively stable weighting distribution compared to other ETFs.
Morningstar, consolidated by the author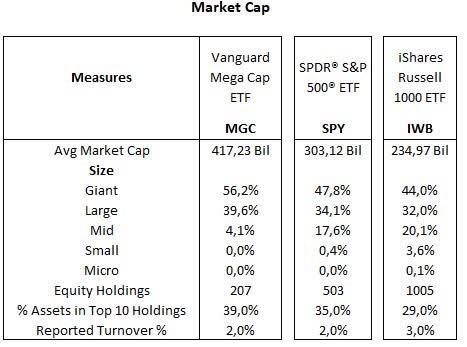
The following table compares MGC with other ETFs that also have an allocation approach toward larger capitalization companies. The first two (USMC and XLG) target the top 50 companies in the S&P 500 by market capitalization. The next two (OEF and EQWL) focus on the top 100 companies, with EQWL using an equal-weight allocation criteria. Completing the list, IWL follows an index of the 200 largest equities in the U.S.
The average market cap for this group of five large-cap ETFs is S$ 562 billion, greater than MGC, and the turnover is roughly 9.6% on average. More active funds like USMC and EQWL have turnovers of 28% and 17%, respectively, while the other three in the group have a more passive bias at below 5%, similar to MGC.
Morningstar, consolidated by the author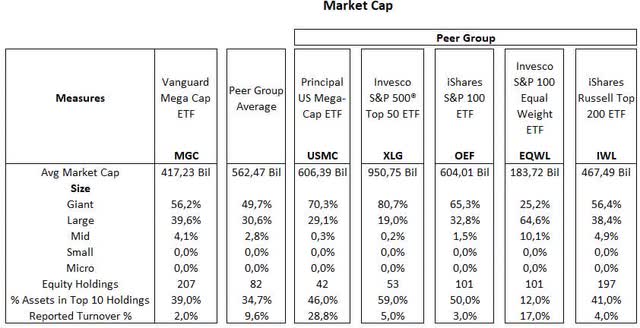
From a sector allocation perspective, MGC’s largest allocation is to the technology sector, with 33.4% of total equities, followed by financials with 13.0%, healthcare 12.6%, consumer cyclical 10.5%, communication services 10.4%, consumer defensive and industrials 6.3% each, energy 3.9%, basic materials 1.4%, utilities 1.3%, and real estate 1.0%. Relative to the S&P 500 index, MGC is slightly overweight in technology (+1.1%), communication services (+1.1%), and marginally in financials, consumer defensive, and healthcare, while underweight in industrials (-1.5%), real estate (-1.2%), utilities (-1.2%) and basic materials (-0.7%). A relative comparison to the Russell 1000 index, represented by the iShares Russell 1000 ETF (IWB), shows a similar trend, with the weighting gaps being slightly steeper across the sectors.
Morningstar, consolidated by the author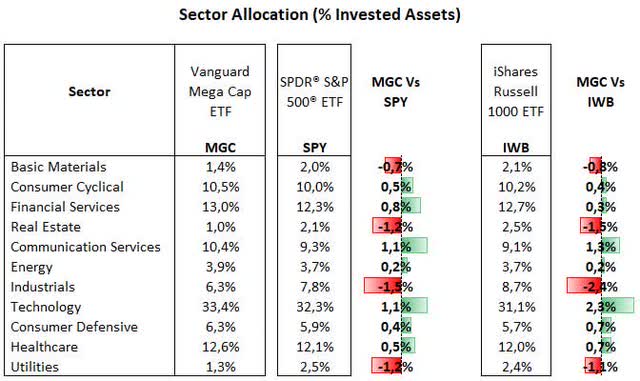
Compared to the peer group of large-cap ETFs, the weighting gaps are also small, with MGC overweight mostly in industrials and technology sectors but underweight in consumer defensive and communication services.
Morningstar, consolidated by the author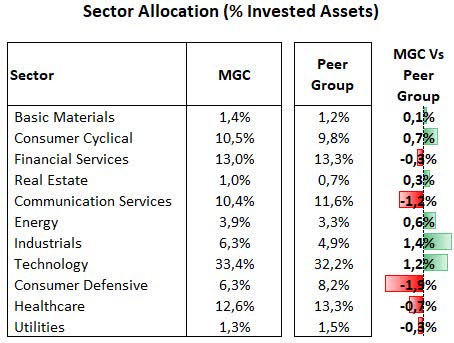
On a valuation basis, MGC shows a price/earnings ratio closely in line with the S&P 500 and the Russell 100 index. On the flip side, its price/sales ratio is relatively higher than the benchmarks. This is reflective of MGC’s heavy allocation to larger capitalization companies that generally have higher profitability indicators.
Morningstar, consolidated by the author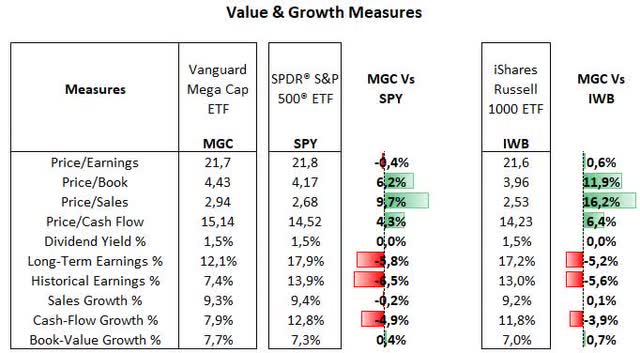
The following table underscores the relationship between size and profitability within the S&P 500 index, breaking it into five quintiles with 100 companies each, according to their market cap. While Tier 1 shows a P/E at nearly 27x, Tier 2 to Tier 5 have a P/E dropping from 23.9x to 22.2x throughout the capitalization spectrum. On the other hand, the price/sales ratio increases steadily from Tier 5 to Tier 1, while profitability measures, such as EBITDA and net income margins, also grow significantly with market capitalization
Seeking Alpha, consolidated by the author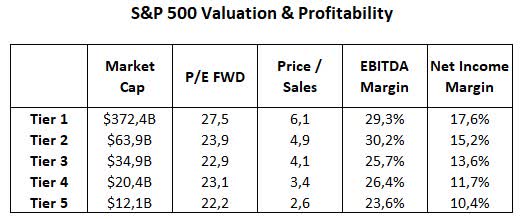
There is a similar effect in a comparison between MGC and the peer group of large-cap ETFs. While MGC’s P/E is quite close to the peer group, its price/sales ratio is relatively lower, as four out of five ETFs in the peer group have allocation focused on Tier 1, the top 100 U.S. companies by market cap.
Morningstar, consolidated by the author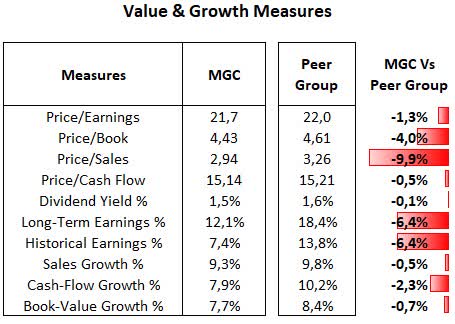
Mega-Cap Leadership Reaffirmed
MGC’s total return has been unequivocally positive over time, surpassing the S&P 500 and the Russell 1000 indexes in all time frames, driven by the strong performance of the largest-capitalization companies in the U.S. stock market.
Morningstar, consolidated by the author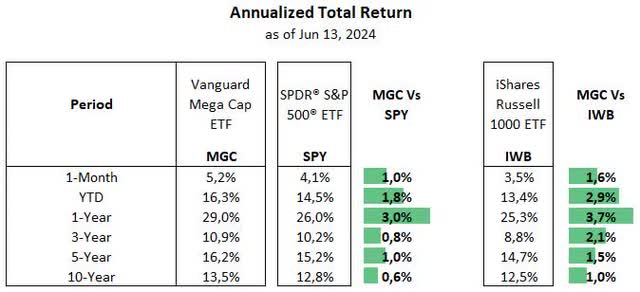
MGC’s returns have been generally in line with the peer group of large-cap ETFs, despite a slight outperformance in the past 1-year period. Breaking down by ETF, we can see that all ETFs in the peer group outpaced the S&P 500 index, except for the equal-weight EQWL, reflecting the market leadership from mega caps over all time frames covered in this analysis
Morningstar, consolidated by the author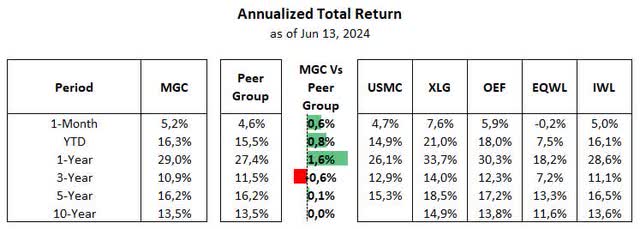
The analysis of risk-adjusted returns shows MGC and the peer group with slightly better Sharp ratios, while volatility measures have been marginally higher than the S&P 500. Meanwhile, spreads and expenses are generally low, implying an interesting cost-benefit for MGC and the peer group.
Morningstar, consolidated by the author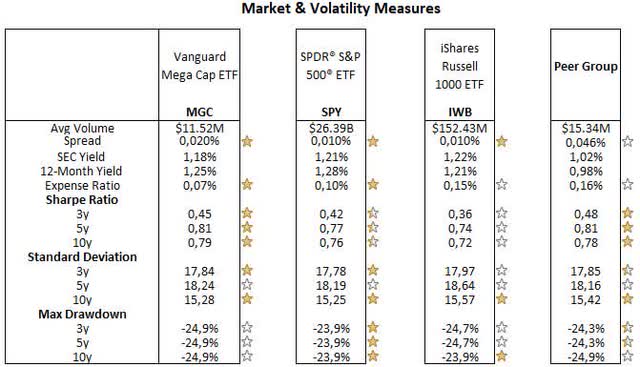
In summary, MGC has a solid track record, with gains above the S&P 500 and no signs of excess volatility. Furthermore, despite the tilt toward larger capitalization companies, its top ten holdings represent 39% of total equities, just 4% higher than the S&P 500, which mitigates the stock concentration risk, a potential issue for less diversified portfolios.
However, MGC’s performance is likely to remain strongly tied to the broader market and subject to drop alongside major indexes in the event of a potential correction, given the substantial price surge over recent months. In spite of that, while we may experience a bumpy road ahead, given uncertainties over the rates path and geopolitics risks, I see MGC and a few other ETFs as well-positioned to continue outperforming the S&P 500 over time, underscored by its heavy allocation to large and high-quality companies that have led the stock over the past years.
Credit: Source link