Kevin Dietsch/Getty Images News
Introduction
On June 12th, the Federal Reserve’s Federal Open Market Committee (“FOMC”) released a statement saying that they intend to hold rates, and that they only anticipate one rate cut through the end of 2024. This means that the Fed Funds Rate, the rate that dictates the lower level of US consumer, commercial, and sovereign interest rates, will remain at 5.25% – 5.50% for now.
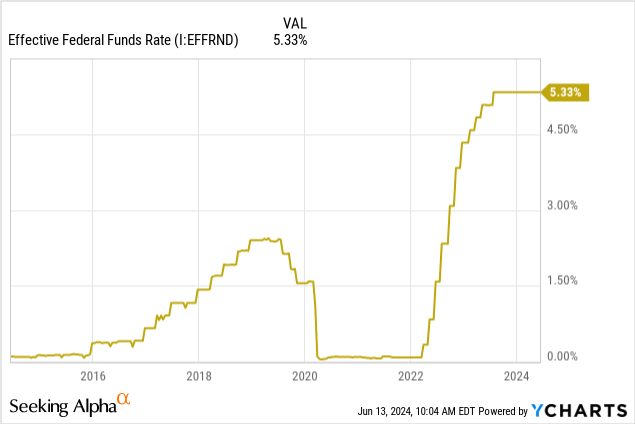
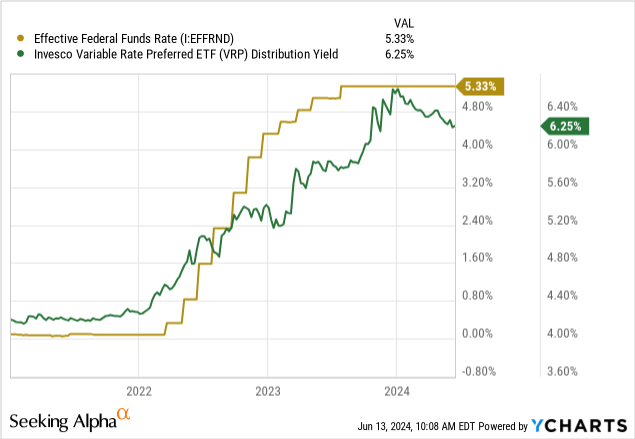
This is a good thing for me as an income investor, as it means that many of the income assets I own tied to ongoing rates like variable-rate bonds will continue to see very high interest rates and pay out far more than they did when the Fed Funds Rate was close to or at 0%.
We can see this in a security like the Invesco Variable Rate Preferred ETF (VRP). Its yield is up 50%+ from 2022, when the Fed Funds Rate was 0%.
More than that, I believe the Fed made the right call based on current economic data. In this article, I am going to examine the Fed’s decision, Powell’s comments, and the current macroeconomic outlook of the US. At the end, I follow up on trades I proposed back in March to capitalize on the Fed’s actions and rate decisions.
The Fed’s Decision
The FOMC press release starts with, in my opinion, the most obvious signal to us that the Fed is content with its current position:
Recent indicators suggest that economic activity has continued to expand at a solid pace. Job gains have remained strong, and the unemployment rate has remained low. Inflation has eased over the past year but remains elevated. In recent months, there has been modest further progress toward the Committee’s 2 percent inflation objective.
The Fed’s dual mandate (maximum employment and low inflation) ensures that these two metrics remain at the forefront of all Fed discussions. Regarding these metrics, the FOMC is correct.
Employment
We have seen a very resilient job market, with unemployment staying low in the past few months. An unemployment rate of around 4%, which we have seen basically since rates were raised, is considered “natural.”
In Powell’s press conference, he spoke to this issue:
Payroll job gains averaged 218 thousand jobs per month in April and May, a pace that is still strong but a bit below that seen in the first quarter. The unemployment rate ticked up but remains low at 4 percent. Strong job creation over the past couple of years has been accompanied by an increase in the supply of workers, reflecting increases in participation among individuals aged 25 to 54 years and a continued strong pace of immigration… Overall, a broad set of indicators suggests that conditions in the labor market have returned to about where they stood on the eve of the pandemic-relatively tight but not overheated. FOMC participants expect labor market strength to continue
The charts don’t lie. They fall in line with what Powell is saying. The job market is strong, despite anecdotal evidence that permeates news media.
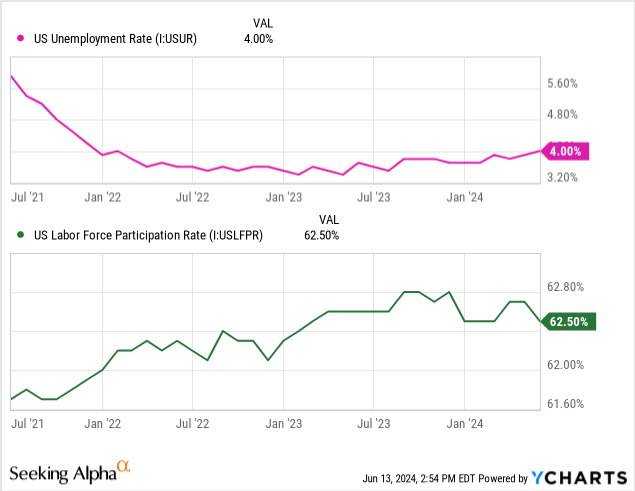
On top of that, we’ve seen a return to above 62% in the labor force participation rate, which tells us that some people who fell out of or left the workforce in the last three years are now returning.
When you peel back the data behind hires and quits/layoffs, we see that we are still in net positive hiring territory. What may be troubling is the decline of hiring and the job opening rate.
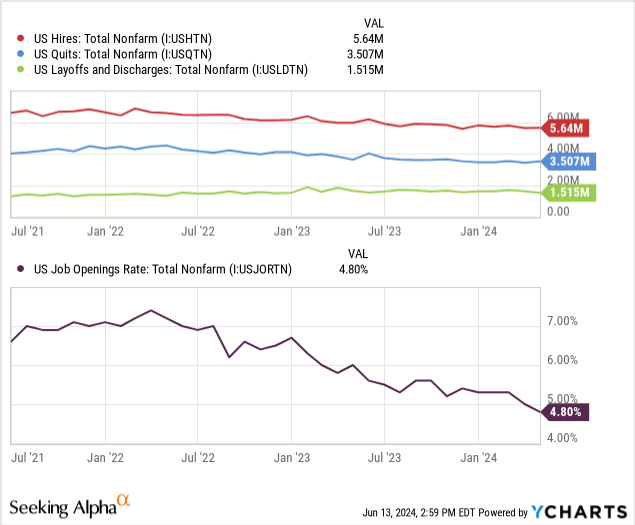
Note: the net difference between hires and quits + layoffs is roughly 618,000 currently.
These are positive signals to the Fed, showing that growth is decelerating, which is what they want to see before they lower rates. I am bullish on this data as well, despite a few pain points still present in the datasets.
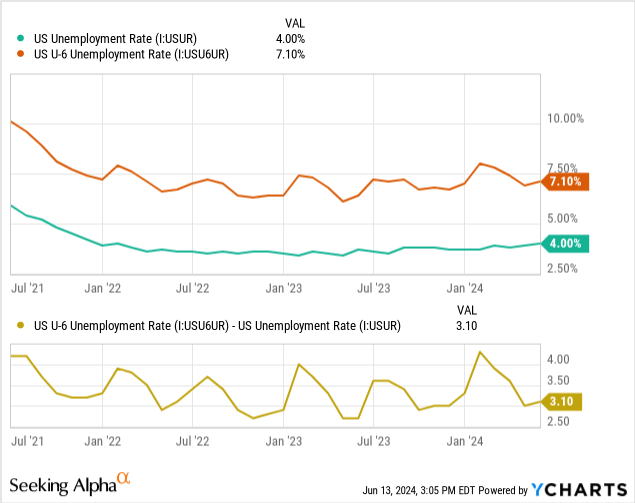
The above is the spread between U-4 (traditional unemployment data) and U-6 data, which also includes discouraged workers and underemployed workers into the calculation. That level, and spread, have been slowly rising since last year. This divergence in the data, and potential future divergence, presents a threat to the Fed’s mission for full employment because they may leave behind these workers not traditionally counted in the U-4 metric.
Inflation
The big headline this week aside from the Fed meeting was the inflation metrics. CPI data came out on a positive for the Fed, showing further disinflation.
Powell sounded very confident when he spoke to this point in the press conference:
The inflation data received earlier this year were higher than expected, though more recent monthly readings have eased somewhat. Longer-term inflation expectations appear to remain well anchored, as reflected in a broad range of surveys of households, businesses, and forecasters, as well as measures from financial markets.
The data itself shows a story of disinflation and looks to be well-anchored indeed, going from its movement since July of last year.
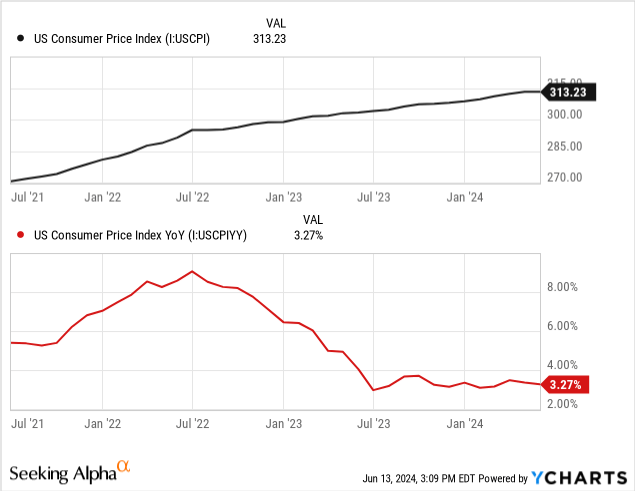
This is a sign that the interest rate hikes have done their job.
The Fed also watches another metric, personal consumption expenditures, which tracks the purchases consumers intend to actually consume, and its calculations are done differently to try and give a more accurate picture of consumer finances.
I nailed the explanation of the difference between these in my April 26th article on the economy, so I’m going to quote that here:
Just for reference:
- CPI, the consumer price index, measures goods and services purchased by consumers
- PCE, personal consumption expenditures, measures only goods and services intended for consumption by households
An example of how these are different can be found in airline fares, among others. The Bureau of Labor Statistics writes about this example.
The PCE index for airline fares is based on passenger revenues and the number of miles traveled by passengers. The CPI, however, is based on prices charged for air travel for sampled routes.
Particularly, they like to use “core PCE,” which measures consumer spending less food and energy. This measure is more stable, since food and energy prices can be very volatile. The Fed gets some flak for this for being an unrealistic look at American living conditions, as food and energy are large expenditures for the average person.
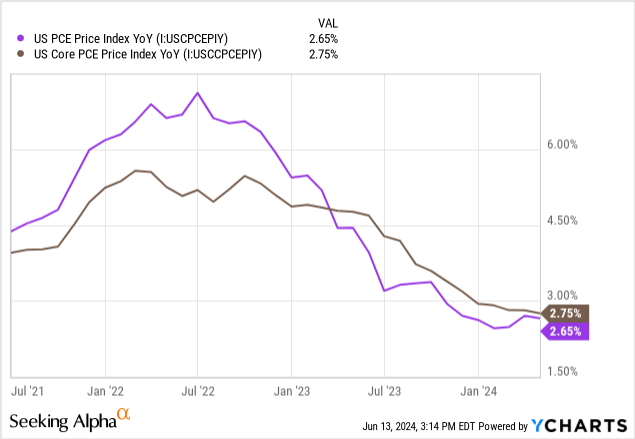
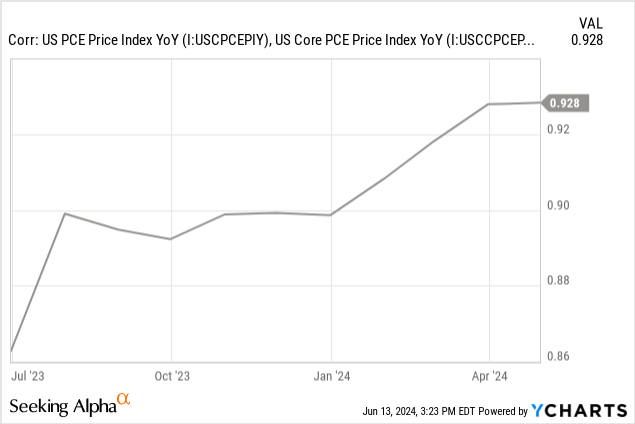
These metrics are also depressed and are on a steeper downtrend than CPI itself. One of the particularly interesting parts is how we’ve seen a convergence in the two metrics, as well as an overall downtrend for the past quarter.
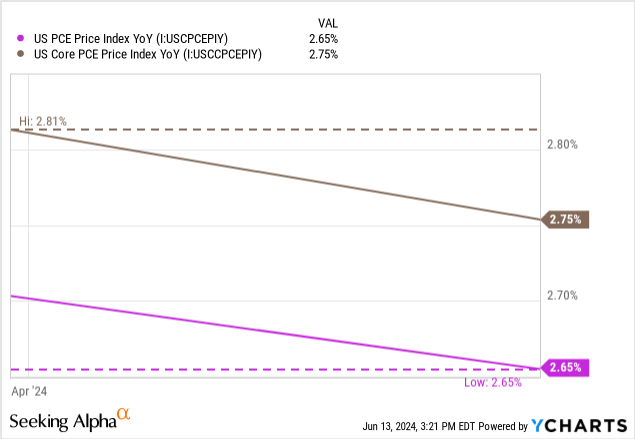
The correlation between the two metrics is changing, and that is a good thing because it means that food and energy prices are becoming less volatile. That is a big win for consumers.
How does that affect the Fed’s decision?
Without trends turning up in inflation or unemployment, the Fed has no need to make any changes. That steady downtrend is the “soft landing” that Powell has been after.
From here, the Fed will want to lower rates as slow as possible, to drag out the effects of these raised rates on the economy. Since the US has not entered a recession, Powell can continue to push the economy along without further meddling. The Fed is currently watching the economy cool in real time.
Even though we are seeing a slowdown, the Fed believes that it’s minor:
Recent indicators suggest that economic activity has continued to expand at a solid pace. Although GDP growth moderated…private domestic final purchases, which excludes inventory investment, government spending, and net exports and usually sends a clearer signal on underlying demand, grew at 2.8 percent in the first quarter, nearly as strong as the second half of 2023.
Here is the chart of that metric, for visual folks.
Figure 1 (FRED)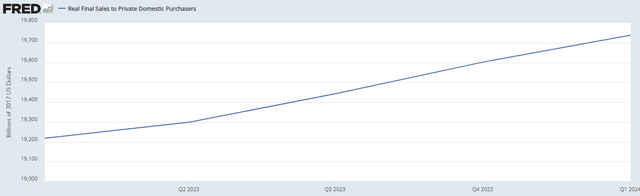
There is still growth, as shown by both a nominal and real rise in GDP, but that growth is slowing, and we are seeing a downtrend in both the QoQ and YoY changes in real GDP.
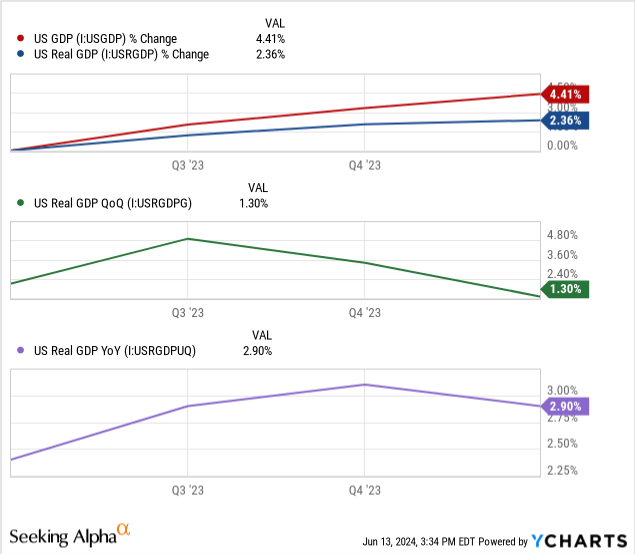
This is a positive for the American economy, as it means that a crash isn’t likely, since the Fed has been able to decelerate growth. This proof of success in slowing the economy is a good sign for Powell and the Fed.
Future Expectations
So what will the Fed do next? They said that there would be one rate cut likely before the end of the year, but do not expect more until 2025. The current participants survey looks like this:
Figure 2 (FOMC)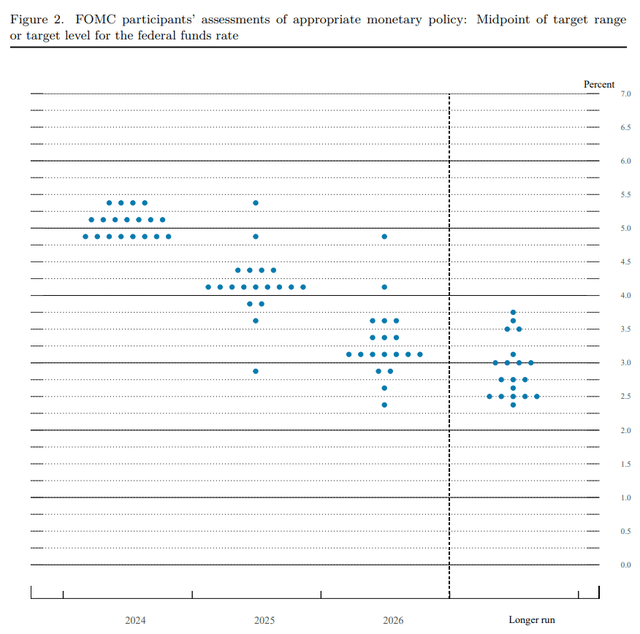
The majority of participants see next year with rates falling to 4% and then to 3% in 2026. This slowing of expectations of rate cuts is meant, in my opinion, to temper the market expectations of bond prices rebounding.
For reference, the futures market is in line with this as well:
Figure 3 (CME Fed Watch)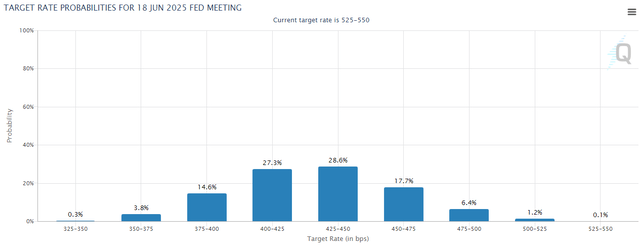
This is the “buy signal” the title of this article references. The Fed is signaling to the bond market that they are going to lower rates slow and steady, and not all at once. This gives bond traders time to continue loading up on duration.
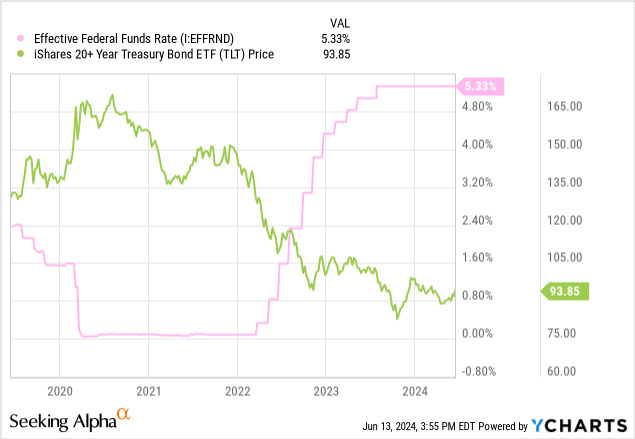
We’ve seen how raising rates can hurt long duration bonds, but that duration means that traders are able to play the upside as well. When the Fed Funds Rate falls, and bond yields fall alongside it, bond prices rise.
Following Up on The Trade
I want to be long duration to take advantage of the “peak” that we are at for rates. While there is no official cap, the Fed had said back in March that we were at the top for rates.
In the linked article above, I discussed a few trade ideas that I want to revisit here. Since rates are still unchanged from then, the thesis that these funds will perform well in a retreating-rate environment is still intact.
I proposed the following:
The Long Duration Play
– 20+yr bond funds like TLT are the way to go to take advantage of falling rates, as their prices rise the most when rates fall.
– Investors may also be interested in Simplify’s take on the duration trade, TUA & TYA, which I wrote about briefly here. This is a leveraged ETF, investors beware!
The Fixed Rate Play
– We know that rates will change in the next nine months, and likely lower. This means that now is the perfect time to lock in rates on CDs or other cash-like instruments that offer fixed rates for long periods of time.
– Newly-issued mortgages are offering incredible rates. Simplify’s MTBA invests only in these high yielding mortgages, which are typically fixed-rates. This gets rid of the lower yielding “fluff” in the index.
– It is time to slowly move out of T-Bills over the next nine months, shifting over to longer timelines.
In total return terms, holding these funds has been very uneventful, and the only fund to outperform the aggregate index was Simplify’s MTBA.
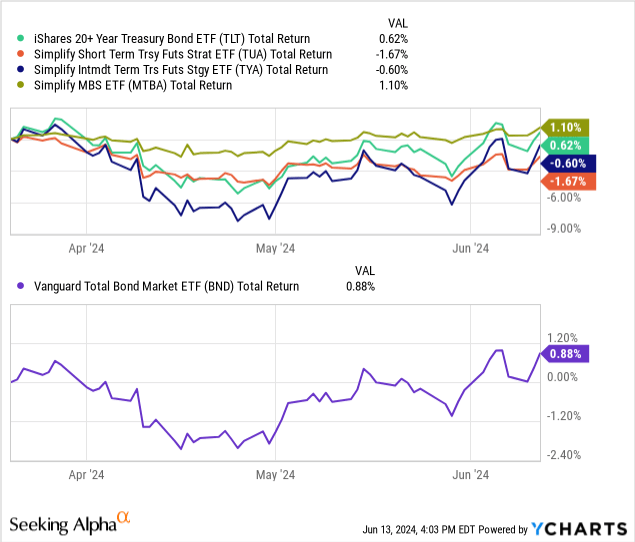
I still believe in this thesis, and believe that remarks from the Fed and current economic data uphold that holding long duration bonds is still the best opportunity in the market. The underperformance in this timeframe, from March 20th to June 13th (the time of writing), can be attributed to the lack of movement in the Fed Funds Rate. As that rate is lowered in the future, the current expectation from both the Fed and the market, we should see significant price returns from these assets.
Risks
The most major risk to the thesis is a black swan, or some event that causes a disruption in the inflation and unemployment trends. Because we cannot predict this, there is little we can do to position ourselves defensively for this risk.
Major indicators to watch for risks to the soft landing thesis that underpins the long duration trades:
- A sudden uptrend in CPI or PCE (core and non)
- An uptrend in unemployment above 5%
- A quarter of negative GDP growth
- This last one means that growth was hindered, and the Fed can no longer “watch the economy cool off”
For those interested in hedging, I do recommend Simplify’s hedge for the long duration position, the Simplify Interest Rate Hedge ETF (PFIX). I would take no more than a 2% stake in it in a portfolio with a duration higher than 10.
Conclusion
I am holding steady with my long duration position and believe it to be a great risk/reward opportunity in the fixed income market for the foreseeable future.
The Fed has signaled the bond market that plans are slowing, but not changing. This, in my opinion, is bullish for investors as it gives us more time to up our portfolio’s duration and transition out of short duration investments like T-bills.
I am looking forward to future releases of economic data that will make or breath this thesis, and will provide updates as the Fed and BLS provide more information to us.
Thanks for reading.
Credit: Source link