

CHUNYIP WONG/iStock via Getty Images
To be honest, I am quite impressed with JPMorgan as an asset manager. Having reviewed several JPMorgan products in the past few months, including the JPMorgan Hedged Equity Laddered Overlay ETF (HELO) and the JPMorgan Equity Premium Income ETF (JEPI), I find JPMorgan tends to manage funds that are best-in-class in their respective fields.
This article analyzes the JPMorgan Realty Income Fund (NYSEARCA:JPRE) to see if it is also a best-in-class real estate fund.
The JPRE ETF is an actively managed fund focused on REIT investments. The manager proactively screens and invests in REITs with strong financials and growth potential.
Looking at the fund’s allocation, I am impressed that the JPRE ETF is overweight Data Center and Apartment REITs, two sectors with strong growth tailwinds.
With interest rates stubbornly high, I believe investors interested in real estate investments will have to select managers who can navigate the challenging macro landscape and select outperforming sub-sectors like the JPRE. I rate JPRE a buy.
Fund Overview
The JPMorgan Realty Income ETF aims to provide high total returns through a combination of current income and capital appreciation. The JPRE ETF primarily invests in stocks of real estate investment trusts (REITs) across the market cap spectrum and is actively managed. The fund continuously screens the REIT universe for companies showing superior financial strength, operating revenues, and attractive growth potential.
The JPRE ETF was formerly a Mutual Fund known as the JPMorgan Realty Income Fund and converted to an ETF structure in May 2022. The JPRE ETF is managed by a team of managers with a combined 66 years of industry experience (Figure 1). For JP Morgan, the JPRE ETF is a relative minnow, with only $313 million in assets. The fund charges a 0.5% net expense ratio.
Figure 1 – JPRE overview (am.jpmorgan.com)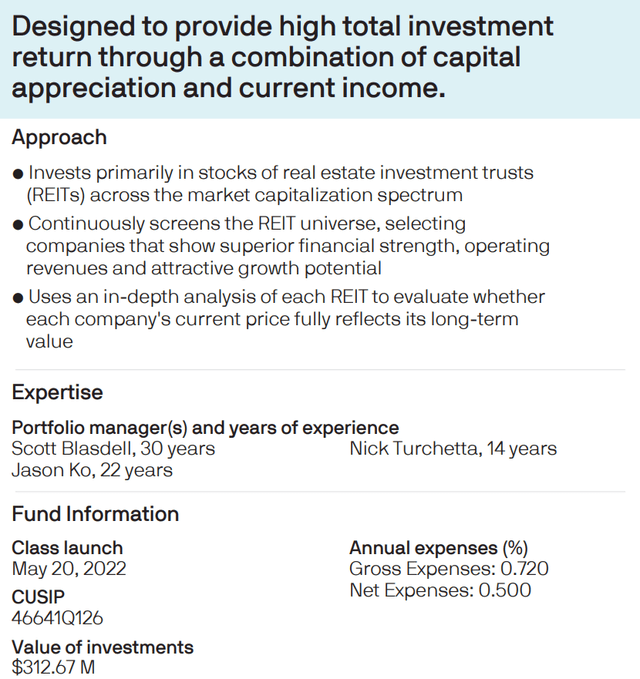
Portfolio Holdings
The JPRE ETF contains 29 positions and Figure 2 shows the sector allocations of the JPRE ETF. The largest sector weights in the JPRE ETF are Diversified REITs at 32.9%, Apartments at 15.7%, Health Care at 15.6%, Industrial at 10.4%, and Shopping Centers at 6.7%.
Figure 2 – JPRE sector allocations (am.jpmorgan.com)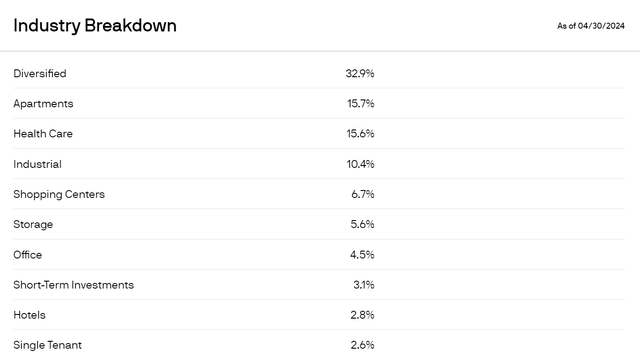
Figure 3 shows the sector allocation of a passive REIT index, the iShares U.S. Real Estate ETF (IYR), for comparison (Figure 3).
Figure 3 – IYR sector allocation (ishares.com)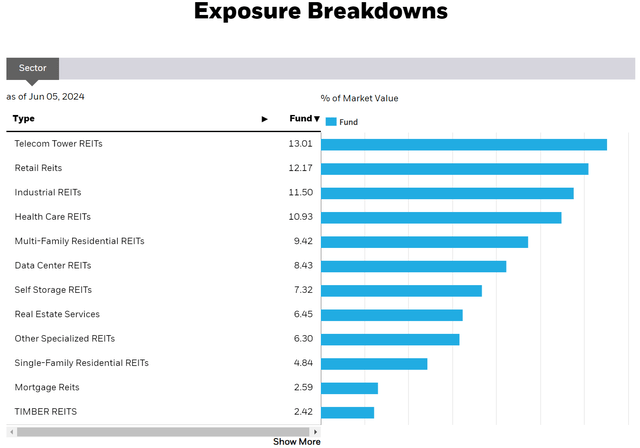
Readers should note that JPMorgan classifies Towers, Data Centers, and Timber REITs as “Diversified REITs”, so relative to the passive index, JPRE has a heavy overweight in this sector (32.9% compared to a combined 23.8% for IYR) (Figure 4).
Figure 4 – JPRE classifies data centers, towers, and timber REITs as diversified REITs (JPRE annual report)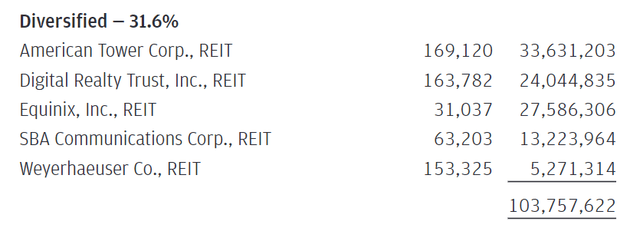
JPRE is also overweight Apartment (15.7% vs. 9.4%) and Health Care (15.6% vs. 10.9%). It is underweight Retail (6.7% vs. 12.2%), Industrials (10.4% vs. 11.5%) and Storage (5.6% vs. 7.3%).
Portfolio Returns
Figure 5 shows the historical returns of the JPRE ETF. While historical returns have been modest, with 3/5/10-yr average annual returns of only -0.2%/3.6%/5.1%/10.7% respectively to May 31, 2024, the issue is mostly with the asset class in the face of rising interest rates. Measured against its peers, the Real Estate category on Morningstar, the JPRE ETF has generally delivered first- or second-quartile performance.
Figure 5 – JPRE historical returns (morningstar.com)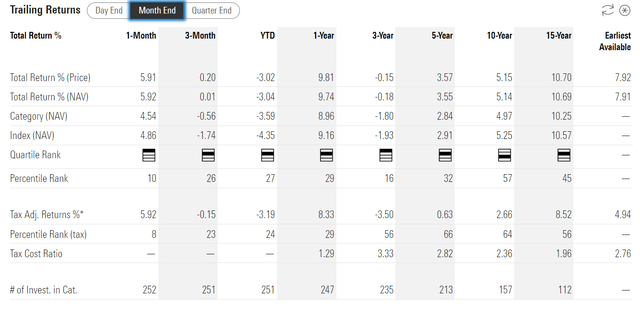
Distributions & Yield
Although the JPRE fund is named a ‘realty income’ fund, the fund itself does not pay a very high distribution yield. The JPRE ETF currently has a 3.1% trailing distribution yield (Figure 6).
Figure 6 – JPRE distribution yield is relatively low (Seeking Alpha)
This could be a result of the fund’s allocations to REITs that historically do not pay high distributions themselves like data centers. Other passive real estate ETFs, like the Vanguard Real Estate ETF (VNQ) and the Real Estate Sector Select SPDR ETF (XLRE) pay higher distribution yields at 4.1% and 3.5% respectively (Figure 7).
Figure 7 – JPRE vs. peers, distribution yield (Seeking Alpha)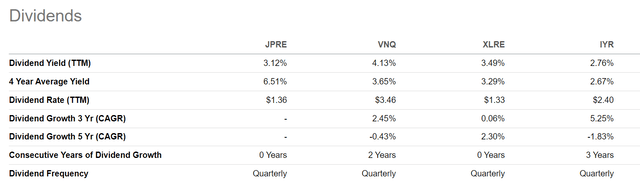
Real Estate Is A Macro-Driven Asset Class
I often get asked by readers why I am so biased against the real estate asset class. For example, I recently wrote a cautious article on the Ares Commercial Real Estate Corporation (ACRE).
To be clear, I am not a biased investor; my writings are simply the output of my top-down macro analysis. In the past, I have written timely bullish and bearish articles on Vornado Realty Trust (VNO).
I am currently cautious about ACRE and other office REITs because I am worried about the massive writedowns we are witnessing across the industry on office towers and office loans.
Lower real estate valuations are mainly driven by higher interest rates, and in the case of office real estate, the long-term macro trend of working from home (“WFH”) policies.
However, within the real estate universe, there are pockets of relative strength. For example, in 2023, real estate outperformers were retail, residential, lodging, health care, and data center REITs (Figure 8).
Figure 8 – Real estate sub-sector performance (reit.com)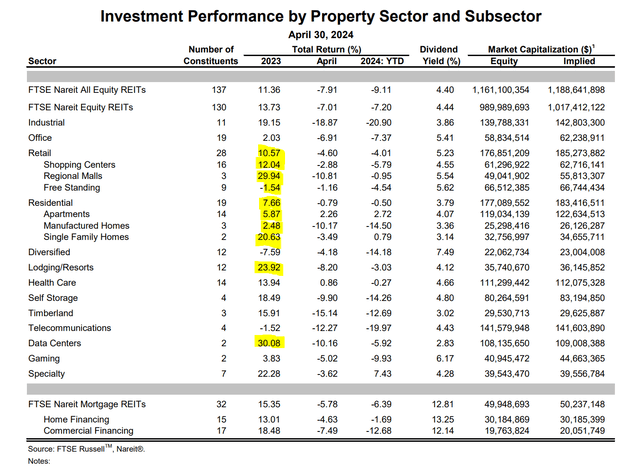
These outperforming sectors have benefitted from various macro drivers. For example, retail REITs benefit from the American consumers’ insatiable appetite to consume; apartments REITs benefit from the current housing supply shortage (Figure 9); while data center REITs have benefited from the interest in artificial intelligence’s (“AI”) demand for computation capacity.
Figure 9 – U.S. has a 3 million housing deficit (axios.com)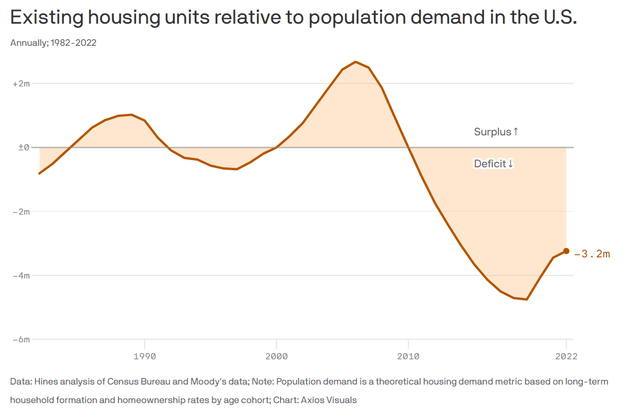
As long as interest rates remain high, I believe investors considering real estate investments will have to be more discerning and find managers who can recognize and capitalize on the major macro trends, instead of simply buying index funds like the IYR. While index funds have worked in the past when interest rates were in a secular decline, they are unlikely to work in the current environment.
For me, I believe JPRE’s differentiated portfolio may be a good vehicle to invest in this tough asset class. From Figure 2 above, we can see JPRE is overweight the sectors with macro tailwinds like Data Centers and Apartments.
Conclusion
The JPMorgan Realty Income ETF (JPRE) is an actively managed fund of REITs. It is managed by industry veterans who screen and select investments with superior financial strength, operating revenues, and growth potential. The JPRE is currently overweight Data Center and Apartment REITS with strong macro tailwinds.
With interest rates remaining high, I believe real estate investors need to be more discerning with their investments and find managers like JPRE who can pick outperforming sectors. I rate JPRE a relative buy.
Credit: Source link