

































kritsapong jieantaratip
JD.com, Inc. (NASDAQ:JD) (OTCPK:JDCMF) reported solid results on 16th May, beating top and bottom line estimates. Somewhat counter-intuitively, it topped the next day and fell -18.5% from the May high to the recent low. This dip could be setting up a good buying opportunity.
The Context
JD has had a rough few years and has made a round trip from the 2018 low of $19.53, up to $108.29 and all the way back again.
JD Daily Chart (TradingView)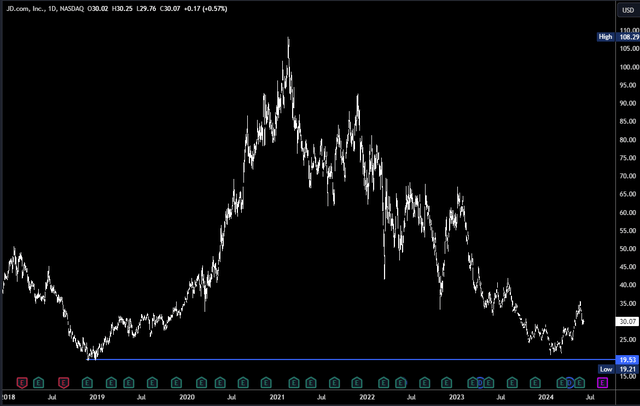
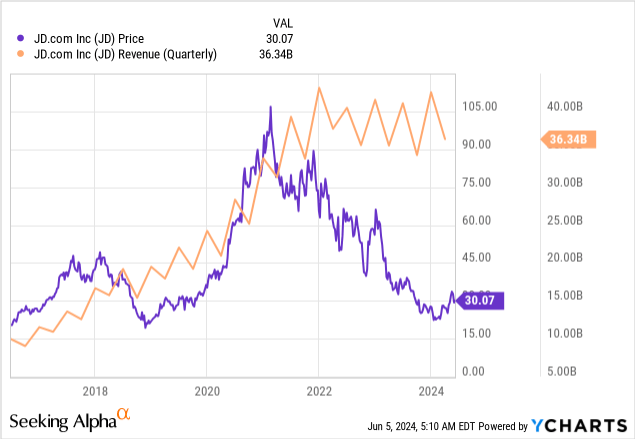
Such a large decline reflects the macro environment in China rather than deteriorating earnings. Revenues have stalled, but have stayed in a general $35-40B range. Q1 earnings showed sales of $36B.
The moves in JD mirror the moves in Chinese stocks, as represented by the China A50. The correlation is consistent.
JD v China A50 (y axis has been modified) (TradingView)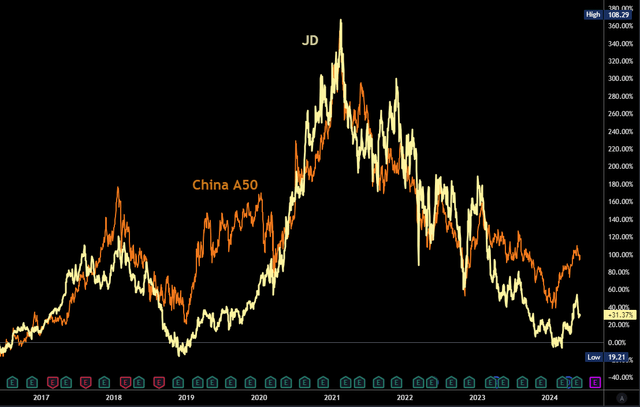
Obviously, JD is a Chinese stock and reliant on the Chinese economy, but the correlation shown above is particularly strong and somewhat unusual. There are not many US stocks in the consumer discretionary sector with such a strong correlation to the S&P 500 (SPY).
JD’s relationship to the China A50 tells us two things – firstly, the decline in recent years is not company-specific. JD has had its problems, but these were primarily caused by macro issues. Secondly, JD isn’t likely to go very far in the opposite direction to the China A50. This could give us confidence when buying the dip, especially if the China A50 continues to rally.
JD v China A50 Short-term (TradingView)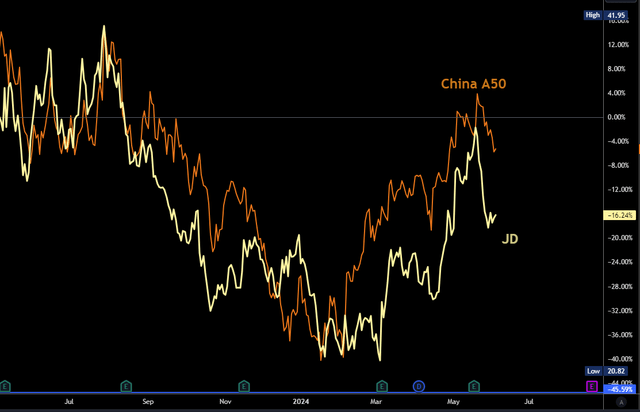
I do think China has turned a corner, at least temporarily. Much of the economic problems have been self-inflicted by the government (Covid policy, popping the property bubble) and there is very little froth left in its markets. This is a positive backdrop for a rally now that the decline has reached the 2018 lows again.
Goldman Sachs recently made a bullish call,
Goldman Sachs noted that history suggests that more is to come if earnings come through. The investment bank spotlighted that over the past 20 years, MSCI China has provided 23 tradable rallies that generated at least 20% returns. The last tradable rally was the “reopening trade” which provided investors with roughly a 57% return from trough to peak in just under 90 calendar days.
Good Results
Q1 results impressed on the top and bottom line.
Q1 Earnings (Seeking Alpha)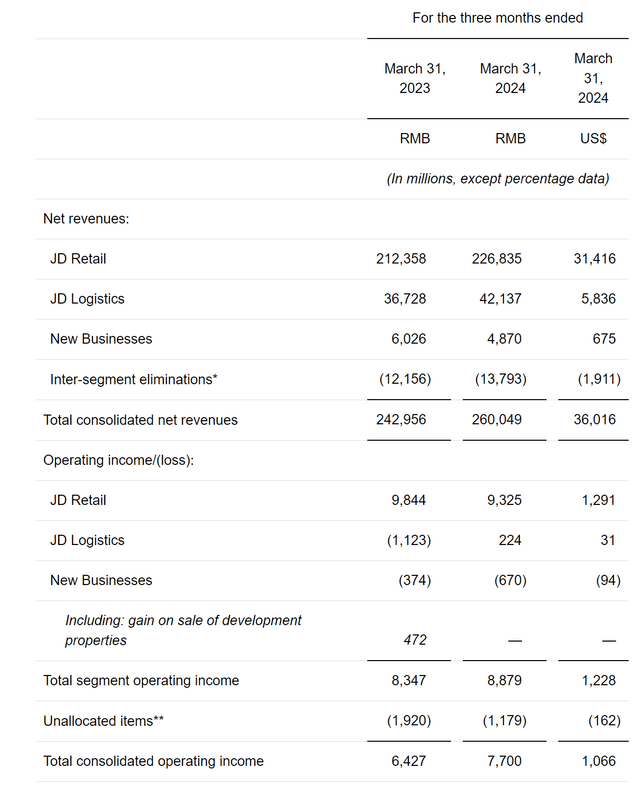
Net revenues increased 7.0% from the first quarter of 2023. Operating income was helped significantly by a turnaround in logistics.
JD has a habit of beating estimates and healthy EPS growth is forecast. Forward PE ratios are attractively in the single digits and should the broader markets in China get back on track, multiple expansion could push the PE ratio towards the teens.
EPS (Seeking Alpha)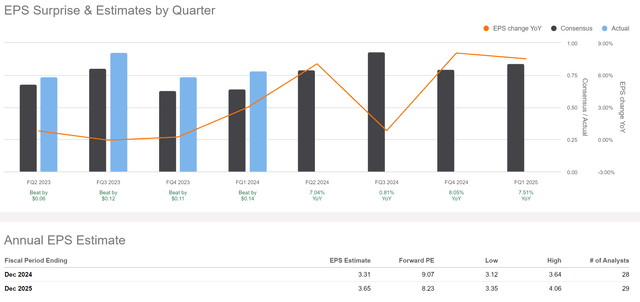
In short, there is plenty of potential upside to the share price from both growing earnings and multiple expansion. Why then did the price fall after earnings?
Bad Reaction
JD peaked on 17th March, the day after earnings were released. Was there something in the report which has been overlooked and could cause major headwinds for JD? I don’t think so. Rather, there are two alternative reasons for the sell-off, and neither are particularly concerning in the bigger picture.
Firstly, I think the reaction was partly driven by short-term profit taking at resistance.
JD Resistance (TradingView)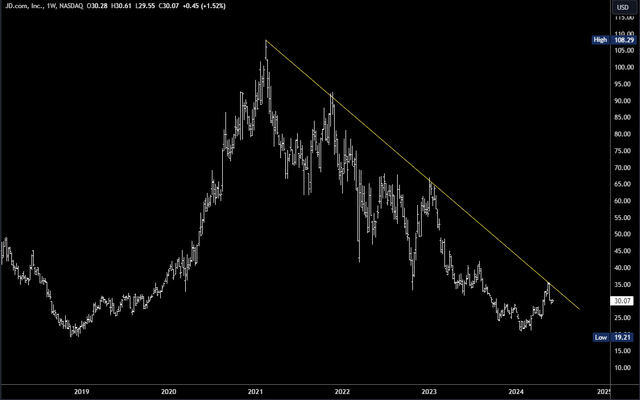
At the high, JD had gained 71% YTD. Furthermore, it was +24% from the beginning of May. Some traders will have speculated on an earnings beat and been overweight JD into the release. The ideal strategy would be to take profits on part of the position and hold the rest as a longer-term investment.
Secondly, Chinese markets have also pulled back, and as highlighted earlier, the correlation with JD is strong. China A50 topped on May 21st and dropped -4%. However, the Hang Seng Index (HSI) has an even higher correlation in the short term. It topped on May 20th and fell -8.3%. Comparing the price moves in the HSI and JD suggests JD was very likely to follow HSI lower despite good earnings.
JD v HSI (TradingView)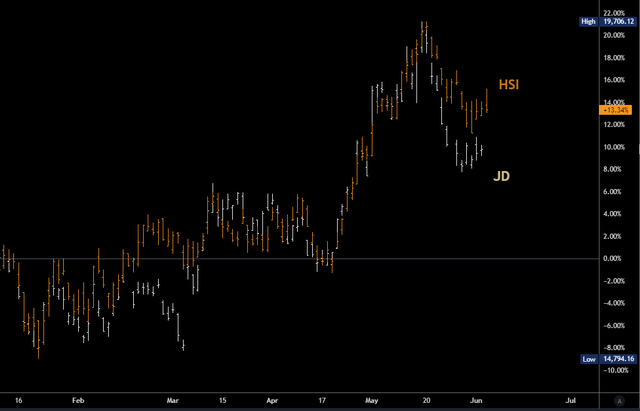
It seems the reasons behind the drop in HSI seem benign and shouldn’t distract us from buying the dip in JD.
The Hang Seng Index, which has rebounded as much as 31 per cent from the year’s low struck last month, experienced a two-week pullback as traders took profits after patchy earnings and economic reports. Local shares are still among the cheapest among regional peers, with Hang Seng Index’s price-to- earnings ratio standing at 9.67, according to Bloomberg data.
Where to Buy the Dip
Some basic technical analysis can help pick a good spot of potential support. There is good confluence in the $26.5-$28 range at the re-test of the 200dma and the break-out level.
JD Technicals (TradingView)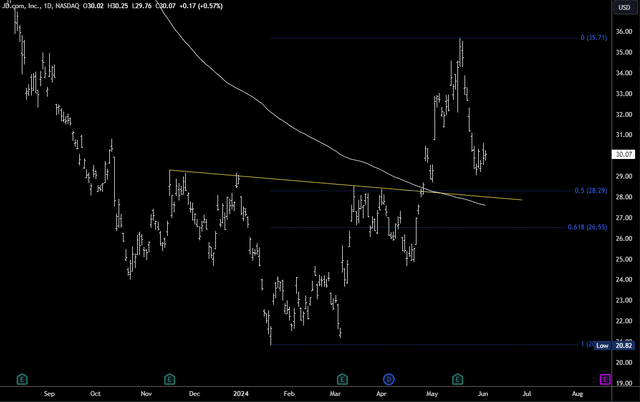
The target is at new highs above $35.69. Indeed, we could look for a proportional rally of around $15 from wherever JD bottoms.
Risks
Breaking $26.5-$28 support could lead to a larger decline to the $24.66 pivot low or even the 2024 low. With earnings out of the way, such a large drop is only likely should the Chinese markets drop sharply.
Conclusions
JD’s Q1 earnings were impressive and the outlook for 2024 and 2025 is positive. The sell-off following the release is likely due to profit taking and correlation to the broader Chinese markets. I think it is creating a buying opportunity in the $26.5-$28 range and new highs above $35.69 can be made this year.
Credit: Source link