
Adam Gault
I often release updates regarding the S&P 500 “SPX” (SP500). My latest report was published on May 27. Today, I maintain my near-term cautious/intermediate and long-term bullish outlook for the SPX, especially for the high-quality “top” stocks.
On Friday, the SPX experienced a hectic post-PCE session, cratering by around 2%, but recovering most of the losses in late trade. However, it hasn’t exactly been a profitable strategy to “Sell in May and go away” this year as the SPX had a considerable recovery after a mild pullback in April.
The million-dollar question is whether the pullback/consolidation phase concludes soon, providing a road to new highs, or if the SPX and stocks generally have more downside ahead.
A Crucial Technical Reversal
SPX (StockCharts.com | Advanced Financial Charts & Technical Analysis Tools)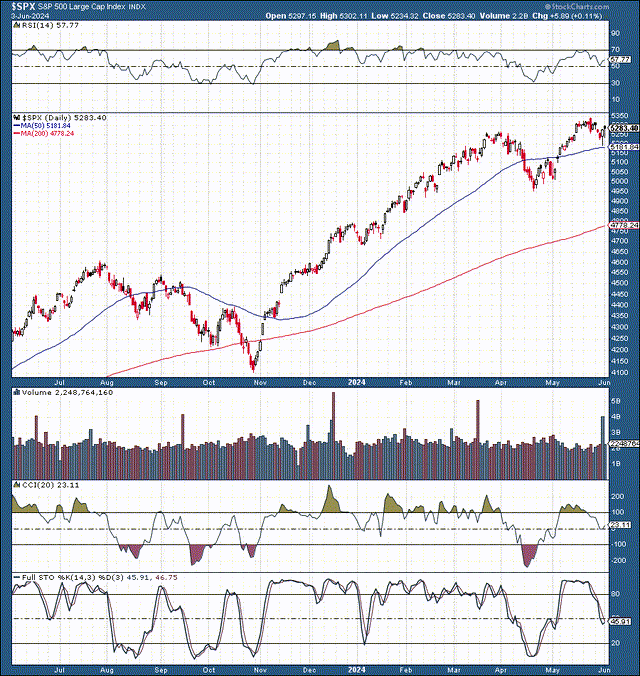
The SPX reversed around the critical support level at 5,180-5,200. This crucial zone coincides with the vital 50-day MA. While the SPX may consolidate around the 5,300-5,200 range, the major average remains in a robust uptrend. The crucial support level remains at the 5,180-5,200 level, and the SPX would likely retest the 5K support zone if the 5,200 level decisively breaks down.
On a positive note, resistance remains around 5,300-5,350, and the SPX can advance to 5,500 or higher once the initial resistance is passed, signaling a positive outlook for the index. Due to the combination of constructive long-term fundamental and technical variables, my year-end SPX target stands in the 5,800-6,000 range.
Continued Progress On Inflation
Core PCE (Investing.com – Stock Market Quotes & Financial News)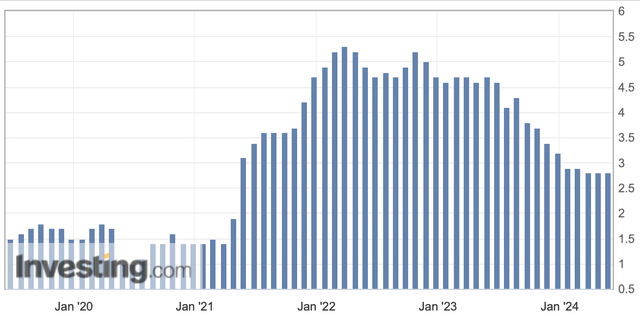
As expected, the recent core-PCE came in at 2.8%, better than last month’s higher-than-anticipated read. This dynamic suggests we have gone through a transitory uptick in inflation and may return to seeing continued progress now. Moreover, we witnessed a similar (higher than expected temporary increase) in the CPI and other inflation gauges. However, the most recent CPI read was also better than expected, illustrating continued improvement in inflation from multiple sources.
What The Real Inflation May Be
Real-time inflation (Independent, economic & financial data in real-time on-chain)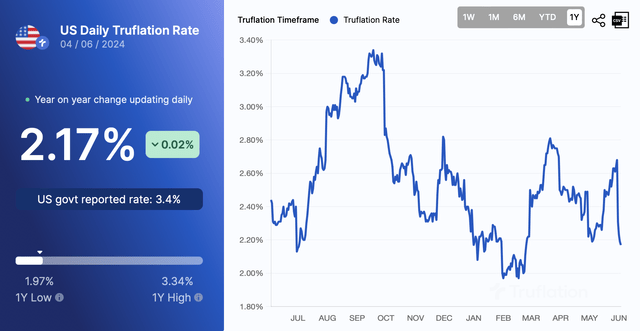
The real inflation rate may be lower than what the CPI and PCE suggest. While the PCE and CPI are lagging government inflation indicators, truflation is more of a real-time (independent, non-government) inflation gauge. Truflation illustrates inflation around 2%, which is relatively low, right around the Fed’s 2% target range. This dynamic implies that the CPI and PCE may move down to the 2% range and the Fed can start cutting interest rates soon.
Rate Cut Probabilities Are Increasing
Rate probabilities (CMEGroup.com)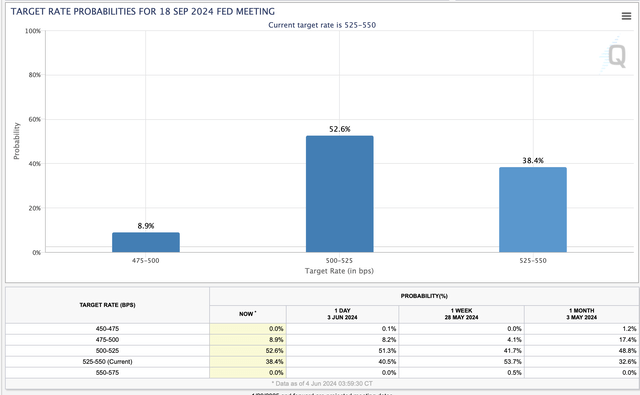
The probability of a rate cut at the September FOMC meeting or sooner is over 60%, considerably higher than the 45% we witnessed a week ago. We’ve seen increased rate cut expectations since the better-than-anticipated CPI, PCE, and other crucial readings. The trend is in the right direction and Fed rate cut probabilities should continue increasing as future better-than-expected economic readings materialize. The next critical read is Friday’s jobs report.
The Crucial Jobs Report
Payrolls (Investing.com – Stock Market Quotes & Financial News)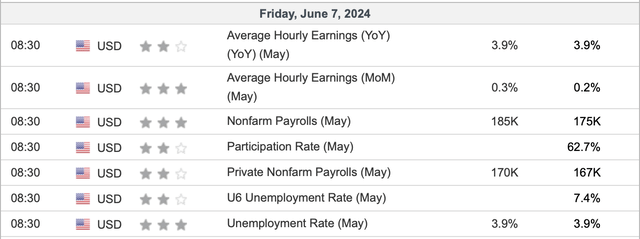
This Friday, we will have a crucial jobs report that could influence rate probabilities and move markets. The expectation is 185K, and last month’s read was 175K. The previous month’s read was constructive as it came in slightly lower than expected, and we want another Goldilocks jobs report.
The market should react favorably to a 100-175K jobs number as it would illustrate a minor softening in the labor market, increasing rate cut expectations while keeping up the image of a highly resilient labor market.
We want to avoid a reading above 200-225K, which could decrease rate cut probabilities. We also want to avoid a jobs number that is too low as it could suggest deterioration in the labor market, leading to concerns about increasing odds of a hard landing or a recession ahead.
Discussing The Earnings Action
We had another very successful and productive earnings season recently with many top, high-quality companies blowing past earnings expectations and offering upbeat guidance for FY 2024 and beyond. Moreover, we’re seeing continued strength in AI-related stocks and other growth areas. We’re also witnessing rebounds in metals, alternative energy, and other constructive areas, suggesting improved economic growth ahead. While most key earnings have commenced now, we’re looking forward to the next earnings season, and I expect we will see more excellent results.
Valuation Check – Is The S&P 500 Expensive?
Index P/E (WSJ.com)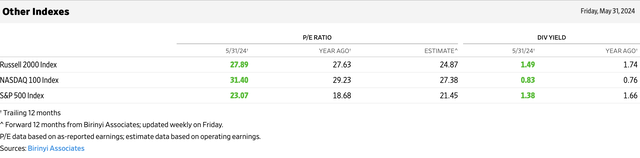
While the SPX’s TTM P/E ratio is around 23, its forward P/E ratio is about 21.5. This phenomenon suggests we could see further SPX appreciation and P/E ratio expansion due to solid long-term growth prospects and a more accessible monetary environment in future years. Also, we have the Nasdaq 100 TTM P/E ratio around 31.4 and its forward P/E ratio around 27.4, implying considerable growth potential and prospects for outperformance. The R2K forward P/E multiple is particularly low, around 25 here. This dynamic illustrates that small and mid-cap stocks could outperform moving forward.
The Bottom Line – The Rally Can Continue
The SPX (ToS Platforms Overview)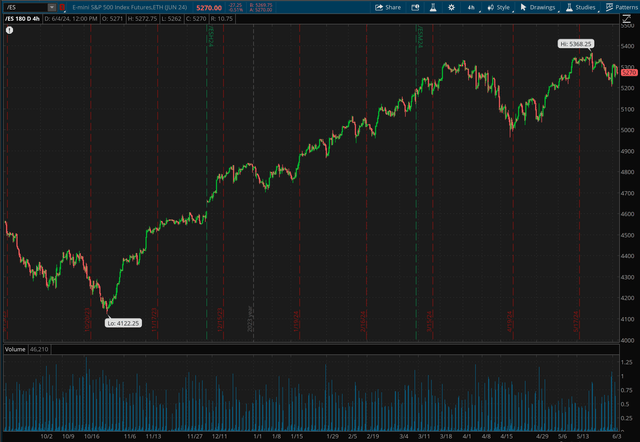
The SPX has come a long way since the 2023 fall correction bottom (30% trough to peak). While we saw a minor pullback several weeks ago, we may see continued volatility and transitory turbulence ahead. Also, the SPX could retest the 5K level and, in a worst-case scenario, could test lower support levels like the one around 4,800 if the 5,200 support level in the SPX decisively breaks down.
Despite the potential for near-term turbulence, it’s crucial to remember that the SPX is still in a long-term uptrend. Several positive factors such as progress on inflation, a resilient economy, and the Federal Reserve’s potential interest rate cuts could propel high-quality stocks significantly higher in the coming years.
An improving growth atmosphere coupled with a more accessible monetary environment should enable high-quality companies to increase sales and improve earnings. Moreover, many companies should benefit from the AI phenomenon (either directly or indirectly), which should translate to higher efficiency and greater profitability. Therefore, stocks and other top-risk assets could continue appreciating, enabling the SPX to hit my 5,800-6,000 target range by year-end.
Credit: Source link