

Jorg Greuel/DigitalVision via Getty Images
Thesis
Growing, profitable, inexpensive, and de-levering is a combination I love. Factor in cautious analysts, and you’ve won me over.
Creative Realities, Inc. (NASDAQ:CREX) guided to grow 27-70% this year to reach revenues of $60-80m. This is a huge range, but I like uncertain situations, especially when analysts forecast a pessimistic scenario. CREX appears cheap, with an EV of $45m and an expected 2024 EBITDA between $7.2m (for $60m at 12% margin) and $12m (for $80m at 15% margin). Having restructured their debt to remove prepayment costs, they intend to use increased cash flows to pay down debt.
Using an earnings model and a discounted cash flow (“DCF”) model under various scenarios, I estimate CREX to be undervalued by around 70%, implying an upside of over 300%.
Introduction
Since my initial write-up only three months ago, we’ve had two quarterly reports. While both reports were pretty good, we’re still waiting for the bigger ramp in revenues, which I expect to happen in Q2.
I wanted to use this article to demonstrate CREX’s potential from a new angle– its operating leverage. To do so, I’ll compare the analyst consensus for 2024’s earnings to a few scenarios with my own earnings model. The results demonstrate CREX’s innate operating leverage. I then present a longer-term outlook for CREX using a DCF model.
This is a companion article to my original write-up. Please refer to the original write-up for a more qualitative analysis of the company, including a risk analysis. This article takes a more quantitative approach.
Analyst expectations
The two analysts covering CREX agree it should generate $60m in revenue and $0.14 EPS in 2024. They give a price target of $6.75, a 106% upside from today. This price target implies a current forward P/E of 48, which is a little difficult to justify. That said, for a business growing perhaps 40% annually, with a third of the business being SaaS, I’d say a P/E ratio of 30 would be reasonable if they can maintain a good growth trajectory. That would imply a fair value for CREX at $4.20, 29% up from today’s price.
I’m going to run through some hypothetical numbers so you can understand the assumptions that would lead analysts to this conclusion. I describe my assumptions in full, but I bold the conclusions for those who want to get to the point faster.
- Forecasted $60m revenue. Given $12m for Q1, that’s $48m for Q2-4 (~$16m a quarter).
- Gross margins were between 46% and 52% in 2023. Let’s assume 46% gross margins, leading to roughly $27.5m in gross profits.
- Opex ramped to $5.8m in Q1. Management doesn’t expect these to move much, but let’s assume $23.8m opex for the full year ($6m/q for Q2-Q4). That would leave a $3.7m operating profit.
- Let’s consider other expenses. CREX earned $35k for cash interest; I’ll just assume a conservative $100k cash interest for the year. As for interest payments, as of Q1 they were at $660k. Let’s assume they continue to fall around $40k each quarter, as they have been doing (due to debt reduction). In reality, I expect this to fall faster. Anyway, that’s likely a $2.4m interest expense for the year. I’ll ignore “change in fair value” charges, despite an income of $600k so far in Q1. So that’s $2.3m in other expenses.
- That would leave a net profit of $1.4m or an EPS of $0.14.
While their exact steps will look slightly different, this loosely demonstrates analyst expectations and provides a starting point for our analysis.
However, a lot depends on the gross margin, which, in truth, I chose to make the numbers work. For my model, I wanted the gross margin to reflect the likely revenue makeup, with different margins for each revenue stream. This is necessary to understand how gross margin might change for different revenue scenarios.
Key earnings model assumptions
If you are not interested in the assumptions, skip to the ‘model results’ section.
Plausible scenarios
Management reaffirmed during the Q1 call that they believe they’ll hit at least $60m in revenue. They have backed down from mentioning the $60-80m range for now. Hence, I reduced the scenarios in my model to a range of $60-70m, which, I think, is more reasonable. I still highly doubt they’ll miss their $60m guidance, so I use this as my base case.
Management also guided for year-over-over quarterly revenue comparisons between around 20-40%. Merging these two pieces of guidance together, we can see that to hit $60k for the year, the average annual revenue growth rate needs to hit 35.5% for Q2-4. I would imagine that management likely set 20-40% growth as the goal for each quarter is to allow for inevitable quarter-to-quarter fluctuations and perhaps to limit expectations for any given quarter.
In my model I will run scenarios for $60, $65 and $70m revenue. Since Q1 is reported, I distribute the remaining revenues across the remaining quarters while keeping YOY growth rates equal, as shown below.
Revenue estimation for scenario 1 (My model)
Model variables
Hardware revenue is the most variable and lumpy category and will, therefore, largely determine 2024’s revenue. It is my main variable. Other revenue streams will change in correlation to this hardware number. Hardware gross profits have averaged 24% since the start of 2023. This should increase marginally as revenues also increase. I will take 25% for this exercise.
The Installation Services revenue stream correlates with Hardware revenue and is, on average, 30% of Hardware sales. I will assume this ratio holds moving forward.
I use the guidance for ARR to estimate Managed Services revenue. In the $60m revenue case, ARR should go from $17.7m by the end of Q1 to $20m by the end of Q4. I assume the hardware of Q1-3 should largely cause that increase in ARR, so I estimate an increase in SaaS of $0.034 per $ of hardware installed in the previous quarter. Incidentally, I analyzed the numbers given for the Panera, Bowling and Starlight Media contracts and found an average increase of $0.045 in SaaS for every dollar of hardware to be installed, so I believe the $0.034 to be a conservative estimation.
Other services have been growing on average $230k each quarter since 2022. To find this growth rate, I added $900k to the most recent two quarters, as management has said that is how much this revenue fell due to the accounting change. Given the accounting change, let’s assume the growth rate is cut by 40%—so it would now be $140k. I’ll reduce this to $100k to be conservative and keep numbers easy.
Other Services Revenue plot since 2022 (Using CREX filings)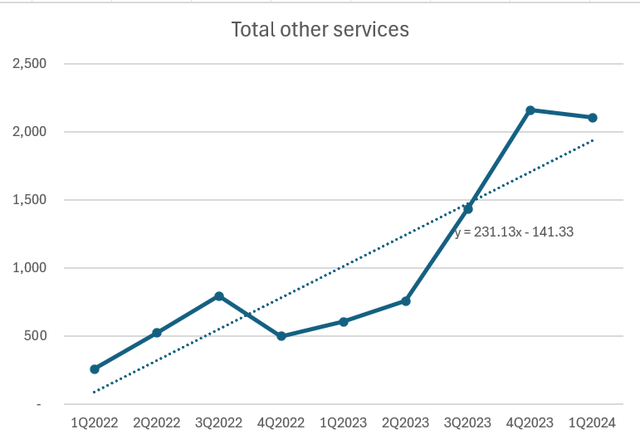
Since 2022, gross margins for the combined Services revenue (i.e., all revenue streams excluding hardware) have averaged 67%. To be conservative, I’ll assume 65%.
Earnings-based model & valuation
Let’s first consider the base case of $60m total revenue (35.5% year-on-year growth). In this case, we get a $27.6m gross profit at a margin of 46%, marginally ahead of analyst expectations of $27.5m.
Earnings based model for CREX 2024 gross profits, scenario 1 (My model)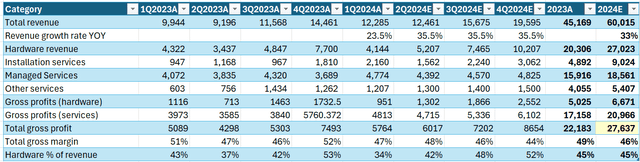
I re-run this model with two other scenarios ($65m and $70m).
Earnings based model for CREX 2024 gross profits, scenario 2 (My model) Earnings based model for CREX 2024 gross profits, scenario 3 (My model)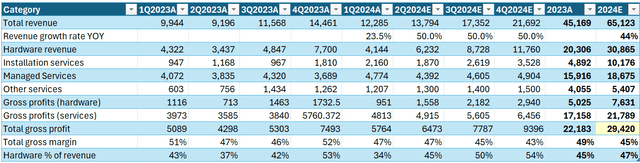
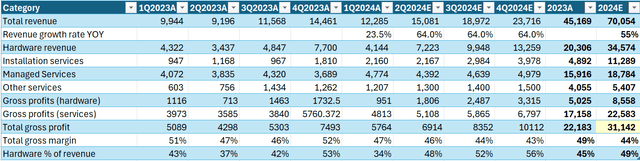
Taking the gross profit outputs for each scenario, I calculated the expected EPS for each scenario. I used a 20x P/E ratio to find the expected share price for each scenario (shown below). After I described the company to a group of eleven investing peers without naming the company, they said they would value the company at 24x earnings on average, so 20x earnings seems reasonable.
| Scenario | Analyst forecast | 1 | 2 | 3 |
| YOY revenue growth rate | 35.5% | 35.5% | 50% | 64% |
| Revenue | 60 | 60 | 65 | 70 |
| Gross profit | 27.5 | 27.6 | 29.4 | 31.1 |
| Opex | 23.8 | 23.8 | 23.8 | 23.8 |
| Operating income | 3.7 | 3.8 | 5.6 | 7.3 |
| Other expenses | 2.3 | 2.3 | 2.3 | 2.3 |
| Net income | 1.4 | 1.5 | 3.3 | 5.0 |
| EPS | 0.14 | 0.15 | 0.33 | 0.50 |
| Expected share price (20x earnings) | 2.80 | 3.00 | 6.60 | 10.00 |
That’s some impressive operating leverage, in my opinion. The base case for my model implies the stock price is marginally overvalued. However, if CREX can hit $65m, the share price could justifiably double. If CREX hits $70m, we could argue for a share price over three times that of today.
EBITDA valuation
To find EBITDA, I added $1.5m to net income for Q2-4, which has been the total reconciliation difference for the last few quarters. This is an oversimplification, but it wouldn’t be far out.
To sense-check these values, I used management’s expected EBITDA margin of 12-15% for 2024. Using this margin, I estimated a 2024 EBITDA between $7.2m (for $60m at a 12% margin) and $12m (for $80m at a 15% margin). The results align well.
| Scenario | Analyst forecast | 1 | 2 | 3 |
| EBITDA | 7.4 | 7.5 | 9.3 | 11.0 |
| EV/EBITDA | 7.5 | 7.5 | 7.5 | 7.5 |
| EV | 56 | 56 | 70 |
83 |
| Market cap | 45 | 45 | 59 | 72 |
| Share price | 4.50 | 4.50 | 5.90 | 7.20 |
Seeking Alpha lists the median sector EV/EBITDA ratio as 7.5. Using this, I produce another set of valuations for each scenario. The results are more concentrated, with the lower revenue scenario suggesting a greater upside and the higher revenue scenario giving a lower upside. In general, I give less weight to EBITDA-based valuations, but these results loosely align with the first model, lending it weight.
Discount Cash Flow Analysis & valuation
I performed a 5-year DCF analysis for my three scenarios. The three scenarios differ in a) the 2024 revenue base and b) the future growth rates of revenues and expenses. For my base case growth rates, I used the current 5-year CAGR for revenue (15%), SG&A expenses (7%) and R&D expenses (3%). In the more optimistic cases for 2024 (scenarios 2 & 3), I slow revenue growth and increase expense growth to account for revenues starting from a higher base and to generally be more conservative.
Assumptions for my DCF (My assumptions)
I show the full DCF model for scenario 1 below. The model suggests a fair-value at $10.94, demonstrating significant undervaluation.
My DCF model for scenario 1 (My model)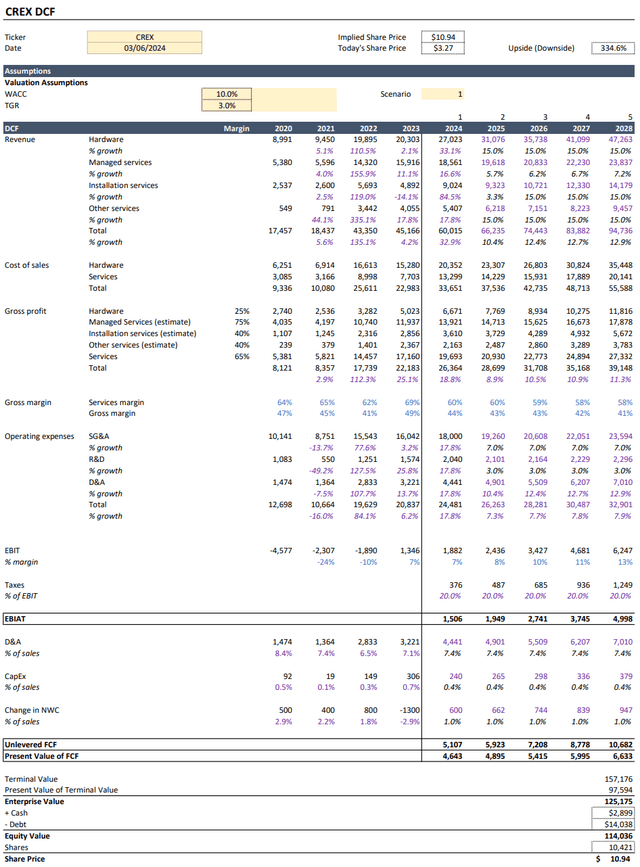
Running the model for scenarios 2 and 3 gives a share value of $11.53 and $11.77, respectively. The limited increase in the fair value of the share price for scenarios 2 and 3 results from my stricter assumptions on future growth and expenses.
Revenue expectations
Given the inherent operating leverage CREX has, a lot comes down to the revenue it hits. In my first article, I wrote the following about management.
When we spoke, I got the sense that the CEO was trying to be very conservative. He certainly got burned in 2023 by project delays leading to a failure to hit his guidance. These projects weren’t lost, and are now underway, which positions 2024 well. However, my impression was that the CEO was attempting to be cautious so as not to overpromise again. Deployment pacing is hard to predict, but I believe the CEO feels the $60m number is very conservative.
I maintain this belief. Management doesn’t want to overpromise. Nonetheless, I felt their commentary on the last call was bullish. For example (emphasis added):
Q – “Is there any change to the revenue guidance range, given the slower ramp discussion on BCTV, or was this contemplated in the low end of the range?”
A – “As we have always indicated, our quarters will be a minimum of 20% to 40% increase over last year. We are still firm in our guidance on $60 million in revenue. Yes, we have contemplated bowling in the lower end of the guidance, Brian. I will tell you, even though bowling is going to be even a little light of where we contemplated it, we believe we will make it up in other parts of the business.“
Management appears to be thinking about it in the same way as I am. $60m is the base that they wouldn’t want to miss. Additionally, there’s plenty of room for upside, depending on how installations ramp up throughout the year.
Summary
I present the results of my three valuation models below. I believe the last method is the most realistic, since cash flows should ultimately determine value for investors. You’re welcome to rely on the model you prefer, or I also averaged across the models.
| Scenario | Analyst forecast | 1 | 2 | 3 |
| Earnings-based valuation (20x) | 2.80 | 3.00 | 6.60 | 10.00 |
| EBITDA-based valuation (7.5x) | 4.50 | 4.50 | 5.90 | 7.20 |
| DCF based valuation | 10.94 | 11.53 | 11.77 | |
| Average | 3.65 | 6.15 | 8.01 | 9.66 |
I like CREX because there seems to be little downside risk. Even if they only hit the lower end of their guidance, $60m, the DCF shows a 300% upside, even if the simple earnings model shows a fair valuation. This divergence results from CREX being a capital-light business with high amortization costs from acquisitions and my choosing a conservative PE ratio.
At the same time, if they bump their revenue up towards $65 or 70m, the earnings model and DCF both support more than a triple.
If Q2 and Q3 results ramp up as I expect them to, the Creative Realities, Inc. stock price should adjust to match the expected full-year EPS, and the cash flows will be more visible. Six months isn’t long to wait.
Editor’s Note: This article covers one or more microcap stocks. Please be aware of the risks associated with these stocks.
Credit: Source link