
haydenbird
The abrdn Income Credit Strategies Fund (NYSE:ACP) is a closed-end fund that income-seeking investors can employ as a method of achieving their goals. This fund has something of a mixed reputation among investors as it has one of the highest yields currently available from any fixed-income fund, and this has led numerous investors to speculate about how sustainable its distribution is likely to be. We can see this situation very clearly by comparing this fund’s current 18.10% yield with that of peers:
|
Fund Name |
CEF Connect Classification |
Current Yield |
|
abrdn Income Credit Strategies Fund |
Fixed Income-Taxable-Senior Loans |
18.10% |
|
Apollo Senior Floating Rate Fund (AFT) |
Fixed Income-Taxable-Senior Loans |
11.53% |
|
BlackRock Debt Strategies Fund (DSU) |
Fixed Income-Taxable-Senior Loans |
10.84% |
|
Carlyle Credit Income Fund (CCIF) |
Fixed Income-Taxable-Senior Loans |
15.46% |
|
Eaton Vance Floating-Rate Income Trust (EFT) |
Fixed Income-Taxable-Senior Loans |
10.64% |
|
First Trust Senior Floating Rate Income Fund II (FCT) |
Fixed Income-Taxable-Senior Loans |
11.20% |
As we can clearly see, none of the fund’s peers comes anywhere close to matching its current yield. In fact, the second highest-yielding fund shown here, the Carlyle Credit Income Fund, has a yield that is 264 basis points below the abrdn Income Credit Strategies Fund. For its part, the Carlyle Credit Income Fund has a yield that is several percentage points above the majority of the rest of the sector. As an outsized yield is frequently a sign that the market expects the fund to be unable to sustain its distribution, the current mixed attitudes that we see among both investors and analysts toward this fund are justified. However, thus far, the fund has sustained the distribution that it has had in place since September 2020.
We previously discussed the abrdn Income Credit Strategies Fund in early September 2023. The market for fixed-income securities since that time has been mixed, as investors and market participants are very unsure about the direction of both monetary and fiscal policy. However, most abrdn funds invest in multiple locations all over the world so the policies of the United States will not have nearly as big an impact on this fund as they would on most other debt funds. At least, theoretically, that should be the case but since capital markets are global and the United States is by far the biggest market, the policies of this country frequently impact everything even when they theoretically should not.
The shares of the abrdn Income Credit Strategies Fund have declined by 6.62% since the date of our previous discussion:
Seeking Alpha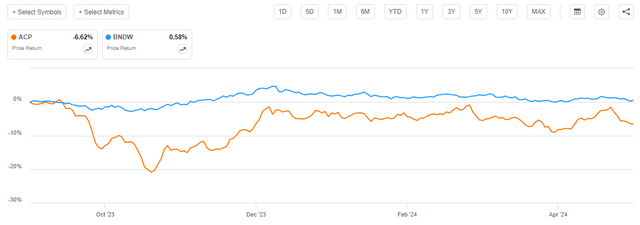
As we can clearly see from the chart above, the Vanguard World Bond ETF (BNDW) is up over the period. The Vanguard Index is probably the best benchmark for this fund, although the composition of this fund is very different from that of the index. We will see that in this article. The fund’s annual report states that the benchmark is the ICE Bank of America Merrill Lynch Global High Yield Constrained Index. There is no exchange-traded fund tracking this index, and most data platforms do not have a way to track the performance of this index so we have to settle for an index that we actually can chart. The simple fact that this fund seems to be underperforming global bonds overall could be a sign that it is indeed paying out more than its investment profits can justify and thus should cut its distribution.
With that said though, the fund’s price performance compared to the index may not be as bad as it looks. As I explained in a previous article:
A simple look at a closed-end fund’s price performance does not necessarily provide an accurate picture of how investors in the fund did during a given period. This is because these funds tend to pay out all of their net investment profits to the shareholders, rather than relying on the capital appreciation of their share price to provide a return. This is the reason why the yields of these funds tend to be much higher than the yield of index funds or most other market assets.
When we include the distributions paid out by both the Vanguard World Bond ETF and the abrdn Income Credit Strategies Fund over the period shown in the chart above, we get this performance chart:
Seeking Alpha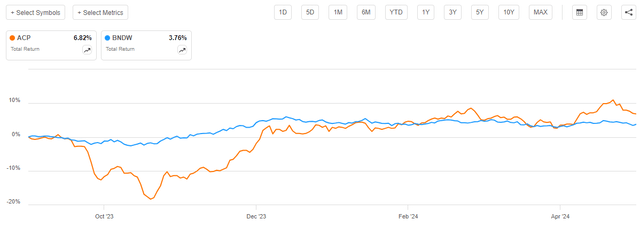
This chart clearly shows the advantages that the higher yield of the abrdn Income Credit Strategies Fund imparts relative to the index. Investors in this fund actually did better than investors in the Vanguard Index Fund despite the fact that the share price performance was much worse. That may be attractive to some investors, although the fact that the fund’s share price declined during the period is still going to be disheartening for those who are trying to live on the distributions.
As my previous article on this fund was published in early September 2023, nearly nine months have passed, so a lot has changed. In particular, the fund released its annual report, so we will want to pay special attention to that as we conduct our analysis.
About The Fund
According to the fund’s website, the abrdn Income Credit Strategies Fund has the primary objective of providing its investors with a high level of current income. This makes a lot of sense given the strategy that the fund employs to achieve this objective. The website explains this strategy:
[The Fund] aims to seek a high level of current income with a secondary objective of capital appreciation.
The Fund seeks to achieve its income objectives by opportunistically investing primarily in debt and loan instruments of issues that operate in a variety of industries and geographic regions. The Fund may invest, without limitation, in credit obligations that are rated below investment grade by an NRSRO such as S&P or Moody’s or unrated credit obligations that are deemed by the Advisers to be of comparable quality.
This strategy works fairly well with the fund’s goal of providing income. As I stated in an article published on this fund back in June 2023:
The fund is thus clearly a debt fund, and this is why the focus on current income as an investment objective makes sense. After all, bonds are by their very nature an income vehicle. An investor will purchase a bond at face value, receive a regular interest payment from the bond issuer, and then receive the face value of the bond back at maturity. Thus, over its lifetime, the only investment return that a bond will deliver is the interest payment. There are no capital gains because a bond has no inherent link to the growth and prosperity of the issuing company.
The strategy description provided on the fund’s website explicitly states that this fund will invest in both debt and loan obligations. This implies that it will purchase both fixed-rate and floating-rate debt. CEF Connect, however, has the abrdn Income Credit Strategies Fund classified as a leveraged loan fund. The CEF Connect classification admittedly does not make a lot of sense when we look at what the fund is actually investing in.
The fund’s first quarter holdings report states that the fund had the following asset allocation on January 31, 2024:
|
Asset Type |
% of Net Assets |
|
Corporate Bonds |
128.5% |
|
Common Stocks |
1.8% |
|
Bank Loans |
0.9% |
|
Preferred Stock |
0.1% |
|
Money Market |
6.5% |
This asset allocation does not look like something that would be employed by a leveraged loan fund at all. Rather, this asset allocation is almost perfectly aligned with that of a global bond fund. More specifically, a global junk bond fund, which we can see by looking at the credit ratings of the securities that are held by this fund:
Fund Fact Sheet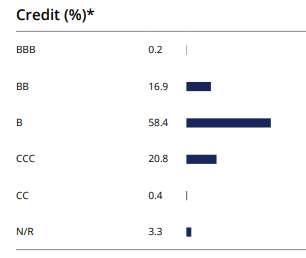
We can see that the majority of the fund’s assets are rated either BB, B, or CCC by one of the major credit rating agencies. This is indicative of a junk bond fund, which does fit pretty well with the strategy description provided on the website. Thus, CEF Connect’s classification of this being a leveraged loan fund makes no sense. The fact that the fund invests in junk bonds instead of leveraged loans does not necessarily pose a problem for investors, although this does mean that the interest rate risk here is a lot higher than it would be for a floating-rate debt fund.
The fund’s yield actually makes a bit more sense if we classify it as a global bond fund instead of as a leveraged loan fund. Here is how the abrdn Income Credit Strategies Fund’s yield compares to other global bond funds:
|
Fund Name |
Current Yield |
|
abrdn Income Credit Strategies Fund |
18.10% |
|
BrandywineGLOBAL – Global Income Opportunities Fund (BWG) |
11.76% |
|
Nuveen Global High Income Fund (JGH) |
9.98% |
|
PIMCO Dynamic Income Opportunities Fund (PDO) |
11.72% |
|
Putnam Premier Income (PPT) |
9.07% |
|
First Trust/abrdn Global Opportunity Income Fund (FAM) |
11.29% |
We can still see that the abrdn Income Credit Strategies Fund has a yield that is far beyond that of most global bond funds. However, one important thing that we may want to consider is which countries a fund is most exposed to. After all, the United States and other developed countries have long had lower yields than most emerging markets. We can see this in the simple fact that the Bloomberg U.S. Aggregate Bond Index (AGG) has a trailing twelve-month yield of 3.42% but the iShares J.P. Morgan USD Emerging Markets Bond ETF (EMB) has a trailing twelve-month yield of 4.85%. Over pretty much the past two decades, the emerging markets bond index has had higher yields than U.S. markets. European developed nation bond yields were even lower than those of the United States:
Trading Economics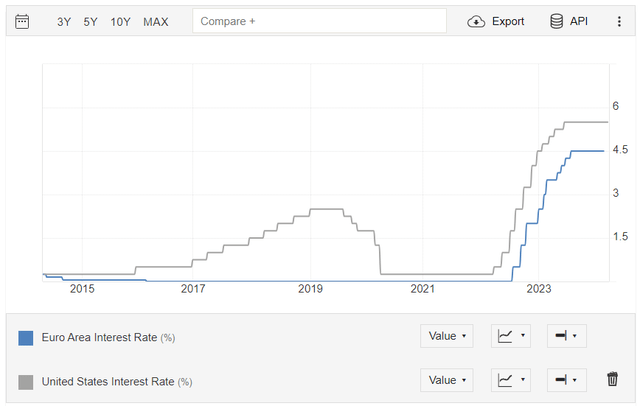
This chart shows the benchmark interest rate of the European Central Bank against the American federal funds rate over the past ten years. As we can see, the interest rate in the European Union was consistently lower than in the United States. That is reflected in the yields of bonds issued by entities on the two sides of the Atlantic Ocean.
The reason that this is important is that the country allocations of each of the respective bond funds will have a huge impact on the effective yield that each fund receives from the assets in its portfolio. All else being equal, a fund that is investing in higher-yielding assets should have more income that it can pass through to its shareholders. This would translate into a higher yield for the fund’s shares.
As regular readers can likely recall, one of my standing complaints about most global bond funds is that they have outsized weightings to the United States. This is not the case with the abrdn Income Credit Strategies Fund, as we can see here:
Fund Fact Sheet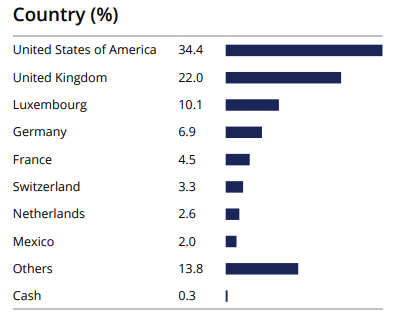
This represents a substantial change from the last time that we looked at this fund. In the previous article, the United States accounted for 51.0% of the fund’s global allocation. Sweden and Canada have both been removed from the largest countries entirely. Switzerland is a new addition, as its companies were not among the fund’s largest geographic weightings the last time that we discussed this fund. Mexico is also a new addition, and unlike the developed nations on this list, Mexico has a very attractive benchmark interest rate of 11.00% right now. Most of the other countries’ issuers now represent a smaller percentage of the fund than the last time that we looked at it, with the notable exception of the United Kingdom. The United Kingdom’s weighting went from 18.2% at the time of our previous discussion to 22.0% now. To summarize:
|
Country |
Weighting Today |
Weighting Sept. 2023 |
% Change |
|
United States |
34.4% |
51.0% |
-16.6% |
|
United Kingdom |
22.0% |
18.2% |
+4% |
|
Luxembourg |
10.1% |
16.5% |
-6.4% |
|
Germany |
6.9% |
8.8% |
-1.9% |
|
France |
4.5% |
10.0% |
-5.5% |
|
Switzerland |
3.3% |
N/A |
+3.3% |
|
Netherlands |
2.6% |
8.6% |
-6.0% |
|
Mexico |
2.0% |
N/A |
+2.0% |
|
Sweden |
N/A |
3.1% |
-3.1% |
|
Canada |
N/A |
2.6% |
-2.6% |
The fact that this fund has a much lower allocation to the United States than most peers gives it access to a broader array of interest rate environments through which it can profit either by buying bonds with very high yields or by buying bonds at a time when the central bank of that country is cutting benchmark rates. This could therefore be a factor that is contributing to the fund’s higher yield than its peers.
Leverage
As is the case with most closed-end funds, the abrdn Income Credit Strategies Fund employs leverage as a method of boosting the effective yield of its portfolio. I explained how this works in my previous article on this fund:
Basically, the fund borrows money and then uses that borrowed money to purchase high-yielding bonds and other assets. As long as the interest rate that the fund has to pay on the borrowed money is lower than the yield of the purchased securities, it works pretty well to boost the effective yield of the portfolio. As this fund is capable of borrowing at institutional rates, which are considerably lower than retail rates, this will usually be the case.
However, the use of debt in this fashion is a double-edged sword. This is because leverage boosts both gains and losses. As such, we want to ensure that the fund does not employ too much leverage since that would expose us to an excessive level of risk. I normally like a fund’s leverage to remain under a third as a percentage of its assets for this reason.
As of the time of writing, the abrdn Income Credit Strategies Fund has leveraged assets comprising 29.27% of its portfolio. This is a bit higher than the 28.78% leverage ratio that the fund had the last time that we discussed it. However, this makes sense considering that the fund’s net asset value has declined over the period:
Barchart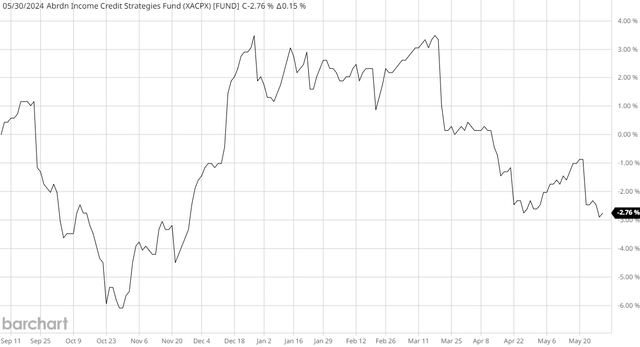
As we can clearly see, the fund’s net asset value has fallen by 2.76% since the date that my previous article on this fund was published. This naturally increased the fund’s leverage ratio because the same amount of debt would now represent a smaller proportion of the portfolio than it did previously.
One thing that we note here though is that the fund’s net asset value did not decline nearly as much as its stock price did during the intervening period. This is something that could have benefits when it comes to the fund’s valuation, which we will discuss later in this article.
We can see that, despite the slight increase in the leverage ratio, the abrdn Income Credit Strategies Fund still remains below the one-third of assets level that we would prefer to see. While this is a good sign, we should still compare it to its peers to determine whether the fund’s leverage ratio is safe given its strategy:
|
Fund Name |
Leverage Ratio |
|
abrdn Income Credit Strategies Fund |
29.27% |
|
BrandywineGLOBAL – Global Income Opportunities Fund |
42.31% |
|
Nuveen Global High Income Fund |
27.92% |
|
PIMCO Dynamic Income Opportunities Fund |
41.37% |
|
Putnam Premier Income |
0.00% |
|
First Trust/abrdn Global Opportunity Income Fund |
19.85% |
(All figures from CEF Data)
For the purposes of this peer comparison, I have opted to use the grouping of global junk bond funds from earlier in the article rather than leveraged loan funds based on CEF Connect’s classification. The funds shown in the table above have more comparable portfolios, so it is probably better to use them.
As we can see, the leverage ratio of the abrdn Income Credit Strategies Fund does not appear to be out of line with that of its peers. The fund’s ratio is slightly above the median ratio of 28.60%, and it is far below the two most-leveraged funds shown here. Thus, it does not appear that the fund is employing an excessive amount of leverage for its particular strategy. Overall, investors should not lose sleep over the fact that the fund has borrowed some money against the assets in its portfolio.
Distribution Analysis
The primary objective of the abrdn Income Credit Strategies Fund is to provide its investors with a high level of current income. To this end, the fund pays a monthly distribution of $0.10 per share ($1.20 per share annually), which gives it a whopping 18.10% yield at the current share price. This is certainly a high enough yield to get the attention of any investor, not only those who want a high level of income.
However, the fund has not been particularly consistent with respect to its distribution over its history. As we can see here, the fund has reduced its payout a few times over its lifetime:
CEF Connect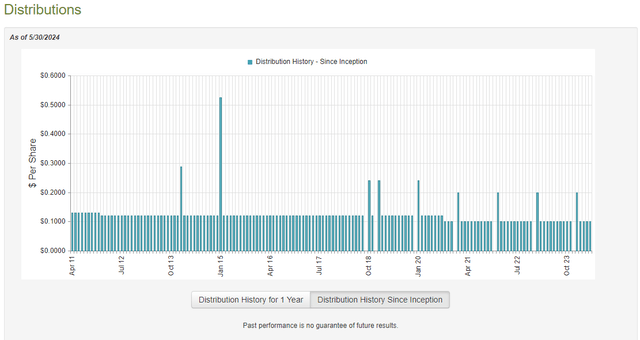
As I stated previously:
For the most part, this distribution has been far less variable than other fixed-income funds, although the fact that it has not been perfectly stable may be a turn-off for some investors. However, the fund has been stable since central banks all over the world started hiking interest rates in the middle of 2022, which is better than other fixed-income funds have been able to achieve.
The fact that this fund has kept a stable distribution since 2020 fits well with its managed distribution policy. This policy is explained in the fund’s annual report:
The Fund’s policy is to provide common shareholders with a stable monthly distribution out of current income, supplemented by realized capital gains and, to the extent necessary, paid-in capital, which is a non-taxable return of capital.
Managed distributions tend to be pretty attractive for investors who are seeking a safe and secure income with which to pay their monthly expenses. It can be an excellent supplement to Social Security for retirees, for example. Unfortunately, sometimes these managed distributions have the effect of destroying the fund’s net asset value because it is unable to generate sufficient investment profits to cover the amount paid out. We should have a look at the fund’s finances to determine whether or not this is the case.
As of the time of writing, the most recent financial report that the fund has released is the annual report corresponding to the full-year period that ended on October 31, 2023. A link to this document was provided earlier in this article. This report is obviously several months old at present, but it is the most recent report available, so it is the best that we have right now. It is also a newer report than what was available the last time that we discussed this fund, so it should work well to provide an update.
For the full-year period that ended on October 31, 2023, the abrdn Income Credit Strategies Fund received $219,015 in dividends (net of foreign withholding taxes) and $37,471,332 in interest from the assets in its portfolio. This gives the fund a total investment income of $37,690,347 for the full-year period. It paid its expenses out of this amount, which left it with $13,419,842 available for shareholders. This was not sufficient to cover the $51,639,484 that the fund paid out in distributions over the period.
The fund was not able to make up the difference through capital gains. The fund reported net realized losses of $57,259,020, which were fully offset by $63,258,523 of net unrealized gains during the period. This was not sufficient to cover the distribution, as clearly shown here:
Fund Annual Report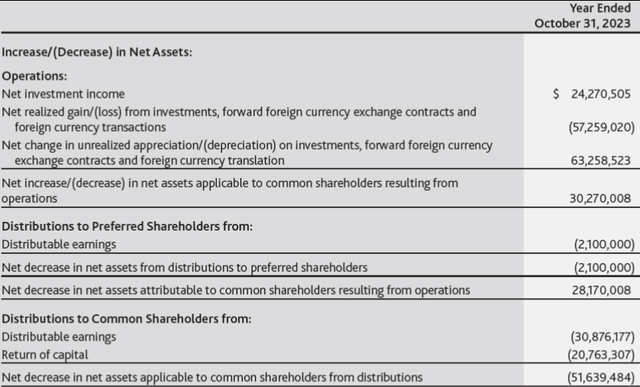
Despite this, the fund’s net assets increased by $173,193,929 after accounting for all inflows and outflows during the period. The reason for this is that the fund issued new shares of common stock, which brought in $196,663,405 during the period. The fund would have seen its net assets decline during the period had it not brought in new money.
Overall, this does not appear to be a sustainable distribution. The issuance of new shares will ultimately mean that the amount of money being paid out will keep increasing, but it is not earning enough on the new money coming in to cover the distributions that it has to pay on the new shares. Thus, the fund will have to either keep raising new money to pay the existing shareholders (until it is eventually unable to do so) or cut the distribution. This is something that we need to keep an eye on, as the fund needs to fix this problem.
With that said, the fund appears to be okay so far. This chart shows its net asset value per share since October 31, 2023 (the closing date of the annual report):
Barchart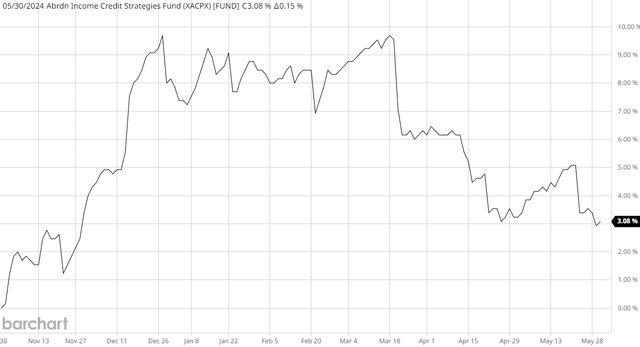
As we can see, the fund’s net asset value per share is up 3.08% since the start of the current fiscal year. This means that the fund has actually covered all of the distributions that it has paid out since October 31, 2023, with money left over.
The takeaway here is that we need to keep an eye on this fund. If the market remains strong, it might be able to fully cover the payout, but there is no guarantee of that. This is especially important to remember right now, as the fund’s net asset value has been declining rapidly since mid-March 2024 and there are no signs that the global bond market will suddenly improve sufficiently to allow for more gains.
Valuation
Shares of the abrdn Income Credit Strategies Fund are currently trading at net asset value. This is much more expensive than the 2.70% discount that the shares have averaged over the past month. As such, it might be best to wait for a bit of weakness in the shares before buying in.
Conclusion
In conclusion, the abrdn Income Credit Strategies Fund is one of the highest-yielding global bond funds on the market. It is also one of the few that is underweight to the United States, and thus can help us achieve the global diversification that most American investors need. However, there are signs that the distribution may be strained, as the fund does not appear to consistently be able to earn sufficient investment profits to cover it. We can see this in the fact that the fund did cover the distribution during the first half of fiscal year 2023 but failed to do so in the second half of the same year. Likewise, it has been covering the payout since early November.
Honestly, though, this fund does not look that bad if you are willing to take on some risks in exchange for that high yield.
Editor’s Note: This article covers one or more microcap stocks. Please be aware of the risks associated with these stocks.
Credit: Source link