

georgeclerk
The VictoryShares US EQ Income Enhanced Volatility Wtd ETF (NASDAQ:CDC), an exchange-traded fund I am initiating coverage of today, is an excellent example of how a seemingly nicely calibrated market-timing strategy can disappoint investors over the long run.
Before we proceed to the discussion of all the intricacies, I should clarify that CDC is a Hold at best, with the reason for that being its rather soft past performance, chiefly resulting from its anemic upside capture. Other reasons that warrant caution include CDC’s tilt toward defensive names, i.e., utilities and consumer staples, and its lackluster growth profile, something that might hinder it from delivering market-like returns in the current environment. Among the positives, I should highlight its appealing valuation supported by competitive dividend yields in the portfolio and rather solid quality, but there are nuances nonetheless that I will address below in the article.
CDC’s strategy basics
As we know from the CDC website, the Nasdaq Victory US Large Cap High Dividend 100 Long/Cash Volatility Weighted Index (the Long/Cash Index) is the basis for its strategy. The index has a biannual reconstitution schedule, with adjustments made in March and September. In the fact sheet, it is explained that constituents are picked from the Nasdaq Victory US Large Cap 500 Volatility Weighted Index; importantly, this index incorporates a quality screen, i.e., companies that were unable to deliver even a thin net profit over the last twelve months are ignored. As I will illustrate below in the note, this rule has likely bolstered CDC’s quality profile. From that universe, the goal is to take 100 highest-yielding names and weigh them using the volatility factor, when less volatile stocks climb to the top and vice versa.
But perhaps the most interesting ingredient here is its peculiar market timing. In short, the idea is to adapt to the market environment by significantly boosting its cash allocation and trimming exposure to equities. As said in the fact sheet, the index
Automatically reduces its exposure to the equity markets during periods of significant market declines and reinvests when market prices have further declined or rebounded.
From the summary prospectus, we know that a “significant market decline” is
a decline of 8% or more from the Reference Index’s all-time daily high closing value compared to its most recent month-end closing value, during which the Index’s exposure to the market may be as low as 25% depending on the magnitude and duration of such decline.
The Nasdaq Victory US Large Cap 100 High Dividend Volatility Weighted Index is the reference index. For instance, one of the scenarios is as follows:
During a period of significant market decline that is 8% or more but less than 16% (the “initial trigger point”), the Index will allocate 75% of the stocks included in the Index to cash or cash equivalents, with the remaining 25% consisting of stocks included in the Reference Index.
Since the principle is convoluted, I recommend investors refer to the prospectus to gain an understanding of all the existing nuances.
CDC’s market timing approach: underperformance despite downside protection
I am of the opinion that ETFs that leverage a low-volatility factor, with or without a market-timing ingredient, should appeal mostly to investors who have a goal to avoid too-deep drawdowns. Put another way, they want a safe haven amid stormy weather in the markets. And what should be appreciated about CDC is that it did deliver on that front over its relatively long trading history of almost 10 years.
Incepted in July 2014, CDC faced a few tough tests, the trade war, the impact of which was perhaps most noticeable in its returns in 2018, the pandemic, the jolty recovery that followed, and the capital shortage era marked by record-high interest rates and omnipresent geopolitical headwinds being among them. So let us compare its maximum drawdowns, downside capture, and standard deviation delivered during these periods to those of the iShares Core S&P 500 ETF (IVV) and the iShares Russell 1000 Value ETF (IWD). I added the latter fund as CDC compares its returns to the Russell 1000 Value Index, which is tracked by IWD.
First, during January 2018–January 2020, CDC had the most comfortable maximum drawdown and the lowest standard deviation in this group. But its downside capture was a bit weaker compared to that of IVV.
| Metric | CDC | IVV | IWD |
| Standard Deviation | 12.73% | 14.22% | 13.97% |
| Maximum Drawdown | -10.49% | -13.45% | -11.75% |
| Downside Capture | 98% | 96.73% | 104.91% |
Data from Portfolio Visualizer
Second, how did it perform during the most challenging days for equities in 2020? In fact, none of the ETFs I am comparing CDC to offered more safety during this tumultuous period.
| Metric | CDC | IVV | IWD |
| Standard Deviation | 20.34% | 25.78% | 28.87% |
| Maximum Drawdown | -15.01% | -19.56% | -26.73% |
| Downside Capture | 65% | 96.70% | 115.92% |
Data from Portfolio Visualizer. The period is January 2020–December 2020
And finally, was it prepared for the 2022 bear market?
| Metric | CDC | IVV | IWD |
| Standard Deviation | 16.92% | 23.36% | 20.97% |
| Maximum Drawdown | -16.45% | -23.93% | -17.78% |
| Downside Capture Ratio (%) | 54.64% | 98.07% | 74.57% |
Data from Portfolio Visualizer
It seems it definitely was, as during the January 2022–Jan 2023 period, it captured just about 54.6% of the market’s downside. Uncoincidentally, in 2022, it outperformed IVV by 10.3%.
So why am I so skeptical about CDC? The issue here is that a small downside capture ratio means little when the upside capture is inadequate. In fact, during the August 2014–April 2024 period, CDC underperformed IVV dismally. Truly, $10,000 invested in it more than doubled, and this ETF also managed to beat the inexpensive U.S. large- and mid-caps represented in IWD. However, the exact same amount allocated to IVV tripled.
| Metric | CDC | IVV | IWD |
| Start Balance | $10,000 | $10,000 | $10,000 |
| End Balance | $23,077 | $31,151 | $21,611 |
| CAGR | 8.96% | 12.36% | 8.22% |
| Standard Deviation | 12.70% | 15.40% | 15.59% |
| Best Year | 33.04% | 31.25% | 26.13% |
| Worst Year | -7.84% | -18.16% | -8.42% |
| Maximum Drawdown | -18.71% | -23.93% | -26.73% |
| Sharpe Ratio | 0.62 | 0.74 | 0.49 |
| Sortino Ratio | 0.96 | 1.15 | 0.73 |
| Upside Capture | 65.38% | 100.28% | 85.07% |
| Downside Capture | 63.84% | 96.78% | 97.12% |
Data from Portfolio Visualizer. The period is August 2014–April 2024
Also, the principal issue was that CDC was entirely unprepared for a recovery in 2023, underperforming IVV by 31.3%. In fact, that year, it delivered a loss of about 5% while the market was marching higher, propped up by the inflation-is-over narrative. And 2023 was not the only year when its strategy disappointed. To give a bit more color, CDC trailed IVV in 6 out of 9 full calendar years it has in the books, including 2015 and 2017–2020 (yes, in 2020 as well, despite its small downside capture ratio touched upon above).
CDC’s factor exposure discussion: risks in the mix
As we know from the holdings dataset available on the ETF’s website, as of May 31, CDC had a portfolio of 100 equities. Cash and cash equivalents accounted for about 55 bps. After analyzing the holdings using financial data from Seeking Alpha, I have identified a few disadvantages the basket has, with the essential culprit being its sector mix. At the same time, I found out that it does offer exposure to competitive dividend yields as well as a mostly comfortable valuation profile overall.
Utilities detract from the growth characteristics
CDC has a pronounced tilt toward defensive names, with utilities and consumer staples accounting for almost 40% of the net assets.
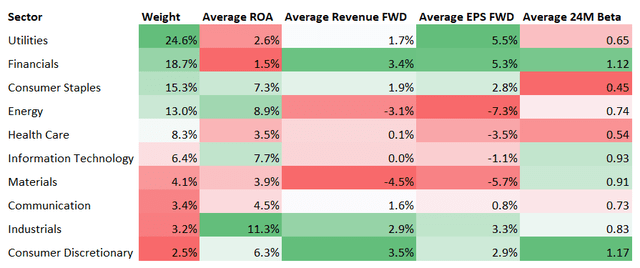
Holdings as of May 31. Financial data as of June 1 (Created by the author using data from Seeking Alpha and CDC)
This is clearly supportive of a weighted-average 24-month beta of just 0.74x, as per my calculations. However, both sectors offer mostly soft growth profiles. Moreover, other sectors represented are even worse on that front, especially energy and materials, as the table above illustrates. For a broader context, almost 30% of the holdings are forecast to deliver lower revenues going forward, while around 31% will likely have to address declining earnings per share. In this regard, the low single-digit WA forward growth rates are anything but surprising.
| EPS Fwd | Revenue fwd |
| 2.2% | 1.11% |
Calculated by the author using data from Seeking Alpha and CDC
In the current market environment, too much defensive exposure combined with subpar growth is a weak and risky proposition.
Value and quality
On the valuation and quality fronts, CDC has a few benefits.
- First, it has an approximately 28% allocation to companies with a B- Quant Valuation rating or higher, which is a healthy result for a portfolio with a weighted-average market cap of $72 billion, as per my calculations.
- Second, its adjusted earnings yield (with negative figures removed) stands at 6.1%, which is 1.6x higher than that of the S&P 500 index.
- Third, the WA dividend yield is also rather strong at 3.87%, with the consumer staples and health care sectors among the top contributors.
- Next, CDC has mostly robust quality, with 87% allocated to companies with a B- Profitability rating or higher. Loss-making companies have only 2.8% weight.
- On the negative side, I find its adjusted Return on Equity of 16% (with negative and triple-digit figures removed) and Return on Assets of 5.1% unappealing, especially the latter, which is principally the result of the index’s volatility-driven weighting that allowed the utilities sector to occupy the top position in the CDC portfolio (its average ROA is 2.6%).
Final thoughts
The VictoryShares US EQ Income Enhanced Volatility Wtd ETF is a comparatively value-heavy bet on U.S. dividend-paying large-caps. It has a noticeable defensive tilt resulting from its sector choices, which, in turn, are a consequence of the volatility-centered weighting schema. With almost 10 years in the books, CDC has amassed respectable assets under management of approximately $832 million. And for a strategy with a peculiar market-timing ingredient, it has a rather modest expense ratio of 38 bps.
I should concur that CDC might have been a nice option for volatility-averse investors. However, the issue is that while sporting a rather comfortable downside capture ratio, CDC has a serious upside capture problem that bodes ill for total returns going forward. So alas, its sophisticated market-timing approach is more of a disappointment. In this regard, I believe a rating above Hold would be clearly excessive.
Credit: Source link