












































Panuwat Dangsungnoen/iStock via Getty Images
I intensely dislike Preferred Shares as an asset class, and I have written the two articles on the subject. Never Buy Preferred Shares – A Lesson From Baseball, The NBA, And The CDO Market (hereafter referred to as Article 1), and, Preferred Shares Are Outperforming, It’s A Great Time To Exit PFF And The Asset Class (hereafter referred to as Article 2). These articles outline why I dislike preferred shares as an asset class. Both articles carried my recommendation that investors exit the asset class. In hindsight, those who followed this advice profited, and the rationale I based this advice on is still valid today. In brief;
- Preferred shares have systematically underperformed the wider market, and in my opinion, this will continue to be the case because;
- They suffer from Asymmetric Returns. In good markets, they don’t participate in the upside because they can be called at the issuer’s option. In really bad markets, when investors need safety the most, their returns are negative and similar to those of common equity, and they do not benefit from falling interest rates in the same way that bonds do. In mediocre markets, they have mediocre returns. Article 1 presents historic data and makes an analogy to various sports that now use data to favour hitters who hit home runs or draw walks over those who hit singles, or 3-point shooters in the NBA over mid-range specialists.
- There are asymmetries of information and market power that adversely affect holders of preferred shares to the benefit of holders of common equities and debt. Corporations have a fiduciary duty to their owners, holders of common equity. This same duty isn’t owed to investors who purchase their preferred shares. So, if a class of investors can be convinced to buy preferred shares at the wrong price, by accepting an expected return that is too low when considering the risk of the investment, then corporations, especially banks, will issue preferred shares. If investors can’t be convinced to accept a substandard return, then the corporation won’t issue new preferred shares. For the common equity holders, it’s, “Heads I win and Pref Shareholders lose, or Tails, I don’t play“. With regard to debt, lenders insert restrictive covenants that prevent certain actions by borrowers, and that allow lenders to take collateral as well as access to non-public information such as the efficiency of assembly lines and factories. Lenders are also often allowed to monitor the company through on-site visits, inspection of IP patents and insurance documents, and various other means. All of these are features of debt that preferred shareholders don’t benefit from, and all of these allow lenders to make more informed decisions about a company’s future prospects than preferred shareholders.
- Retail Investors who are the target market for issuers of preferred shares are often told that they will provide downside protection and a safe home in periods of financial stress. As per the data presented in Articles 1 and 2, and in Section 1 below, historically, this isn’t the case. Further, in terms of bankruptcies;
- As per Article 1, the “insurance” that preferred shareholders purchase through accepting a substandard expected return is for an event, bankruptcy, that happens far less frequently than a meteor hits the earth, and even less frequently than a meteor actually hitting a house.
- The protection/payout of that insurance has been illusory. In recent years, Subordinated Debt, a category which is an amalgamation of Senior Subordinated Debt and Junior Subordinated Debt, has had a recovery ratio of approximately 20%. Data from the rating agencies shows that on average, senior secured bank debt recovers 70 cents on the dollar, senior unsecured bonds recover 40%, and junior unsecured bonds, which rank higher than preferred shares, recover 15%. Crucially, the 15% recovery rate for junior subordinated bonds is the mean rate. The median rate of recovery, the value observed most often, has been as low as 2%. There really isn’t much left over for preferred shareholders to recover when a company goes bankrupt.
- Other benefits such as tax efficiency for retail investors are minimal at best, and are often achieved at the expense of the corporation in question. Often there are better methods of achieving the same ends.
So why pay an inflated price to buy something that has little if any value?
In my opinion, preferred shares issued by mREITs are amongst the worst types for investors to buy, followed by those issued by Financial Institutions, and finally, preferred shares issued by corporations or utilities. I refer readers to Article 2 if they are interested in why I hold this opinion, but one of the major reasons is that banks (and mREITs) do not have a cap on supply. If a bank or mREIT such as JPMorgan Chase & Co (JPM) decides to purchase a $5 billion portfolio of loans or mortgages, and it needs capital, it will tend to issue preferred shares instead of diluting common shareholders. Utilities find it harder to build a $5 billion dam every other month, so there is a natural cap on their issuance of preferred shares.
The Global X U.S. Preferred ETF (NYSEARCA:PFFD) has a high concentration of preferred shares issued by US Banks. Eight of its top ten holdings (representing 16% of its AUM), and 16 of its top 20 holdings, are issued by banks. JPMorgan, Wells Fargo & Company (WFC), Bank of America Corporation (BAC), and Citigroup Inc. (C) are especially prominent.
As outlined below in Section II, the advent of Bank Stress tests conducted by the Federal Reserve has inserted an element of seasonality to the S&P 500 (SPX), the common equity of banks, and to preferred shares. Prior to the Credit Crunch, both the S&P 500 and bank stocks performed better in the first half of the year. The reverse has been true over the past 10 years, equities perform better in the second half of the year. Preferred shares by contrast, do very poorly in the second half of the year. The common trigger seems to be the fact that the results of the Fed’s stress tests are usually released in the last week of June.
It’s always a good time to eradicate preferred shares from your portfolio – they steal the return on your hard earned capital for the benefit of common equity holders. Now is an especially good time to do this, especially for ETFs such as PFFD that are concentrated in preferred shares issued by banks.
Accordingly, I rate PFFD as a Strong Sell.
Historic Results
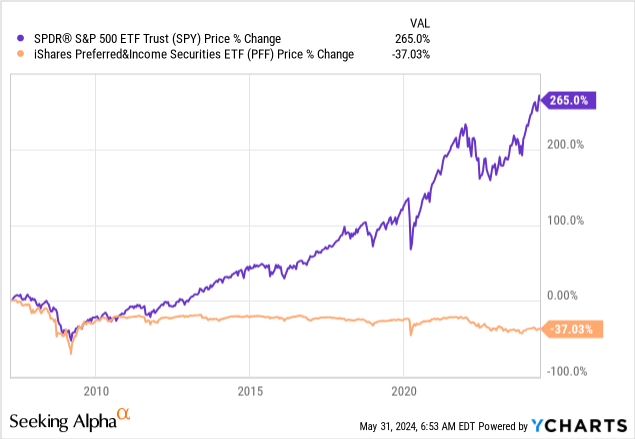
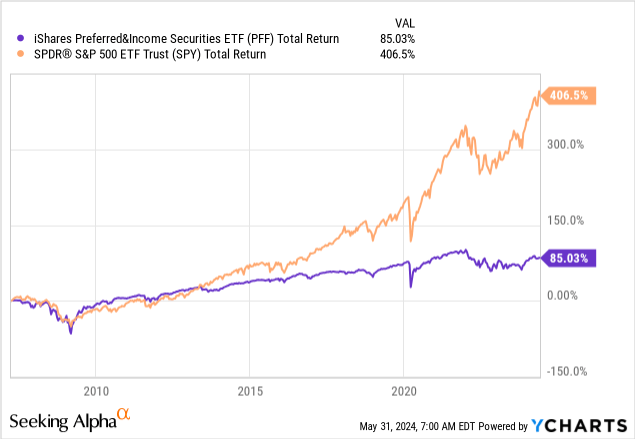
The iShares Preferred & Income Securities ETF (PFF) has the longest history of any specialized ETF that invests in preferred shares. As per Graphs 1 and 2, it has been a brutal investment.
Interestingly enough, the difference between the Total Return of SPY and its Price Percentage change (141.5%) is greater than the same difference for PFF (122%). This appears to indicate that while the dividend yield of preferred shares may be initially greater than that of their common equity counterparts, over time, the growth of common equity dividends means that investors receive more income than preferred shareholders do. And of course, common equity holders participate in the upside and growth of a business whereas preferred shareholders do not.
Graph 1: Historic Price Change of PFF versus SPY
Graph 2: Historic Total Return of PFF versus SPY
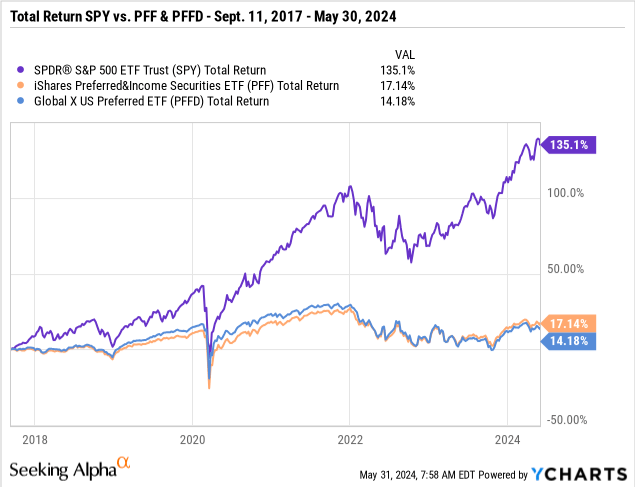
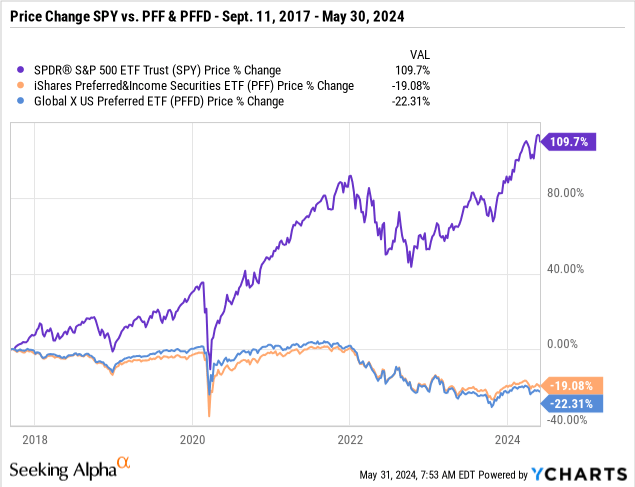
In what was either an unfortunate coincidence, or a clever feat of subliminal marketing designed to take advantage of the fear and uncertainty many felt at the time of 9/11, the inception date of PFFD was September 11, 2017.
As per Graphs 3 & 4, it too has been a sub-standard investment, and with its heavy concentration in financials, it has underperformed PFF as well as SPY.
Graph 3: Total Return of PFFD versus SPY and PFF
Graph 4: Price Change of PFFD versus SPY and PFF
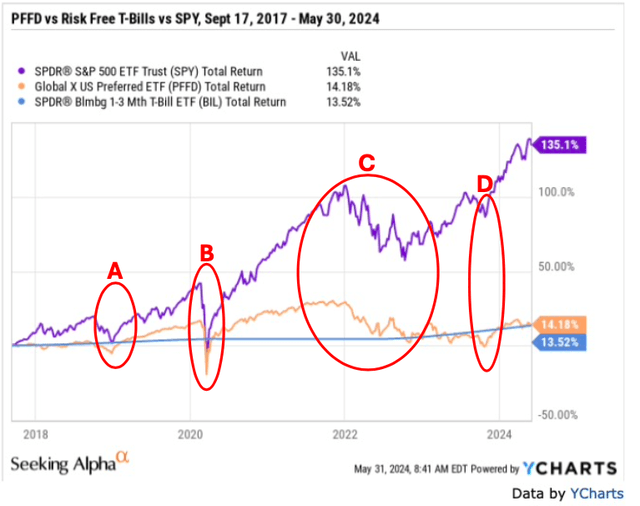
You can’t get much safer than cash or short term Treasury Bills. For the risk they take, PFFD investors deserve a far greater return than T-Bills pay.
Graph 5: PFFD hasn’t outperformed cash, and it certainly hasn’t kept track with inflation.
Source Y-Charts (Y-Charts)
As well as failing to keep track with inflation, the so called safe haven that PDDF is supposed to provide in times of market stress isn’t usually there. For three of the four periods when markets have sold off during its life, Periods A,B, and D, PFFD experienced negative returns of a similar magnitude as SPY’s. And even in Period C, there was no counter cyclicality or price appreciation to protect a portfolio, as is usually the case with bonds. Consider the following two periods of market stress;
- In August 2007, 10-Year Bond Yields were 4.45% and by March 2009, they had fallen to 2.20%. PFFD wasn’t around but PFF was. Its price fell from $46.75 to $21. So much for safe havens and preferred shares rising in price when interest rates fall.
- On Nov 13, 2019, 10-Year Bond yields were 3.21%. On April 3, 2020 they were 0.72%. During this time, PFFD’s Price fell from $24.88 to $20.91, a sell off of 16% in less than five months, at a time when 10-year bonds appreciated by approximately 12%.
Why would anyone ever want to own PFFD? It offers a similar risk profile as common equity without upside participation, minimal protection in a bankruptcy proceeding, lower income than common equity over the long term, all for a similar expected total return that can be earned in risk free T-bills.
Seasonality – Why now is a particularly good time to exit PFFD
Recently I was looking into the old saying, “Sell in May and Go Away”. Investors who followed this advice in the last ten years have left a lot of money on the table.
Table 1: SPY – First Half vs. Second Half Performance

Seeking Alpha
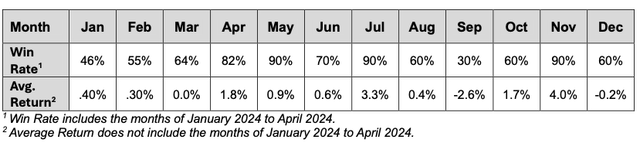
As can be seen from Tables 1 and 2, there has been a sea change in the seasonal pattern of the S&P 500.
Table 2: SPY – Monthly Data 2013- 2023
Seeking Alpha
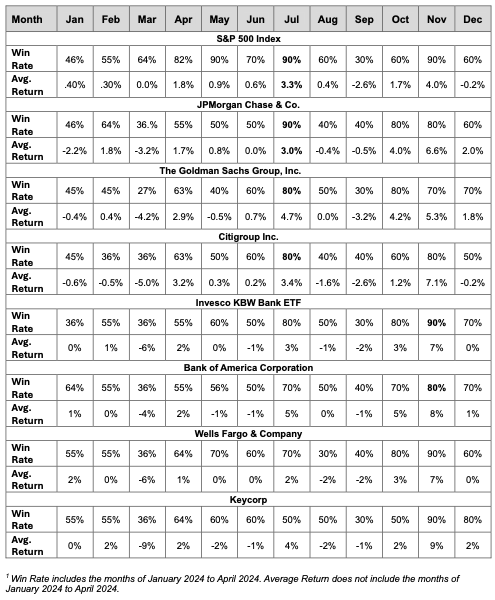
Before the Credit Crunch of 2008-2009, the first half of the year was when the majority of SPY’s gains occurred, while after the Credit Crunch, the opposite has been true. I believe that this change can be explained, at least in part, by the annual stress tests that the Fed introduced in 2011 as a response to the Credit Crunch. Table 3 shows monthly data for a number of the banks that are undergoing the 2024 Stress Test Scenarios.
Table 3: Monthly Data For Bank Common Equity, 2013- 2023
Seeking Alpha
For common equity holders of banks, there appears to be a classic case of sell the rumor and buy the fact, where risk averse investors worried about the results of stress tests exit their positions in June, and then re-establish them in July.
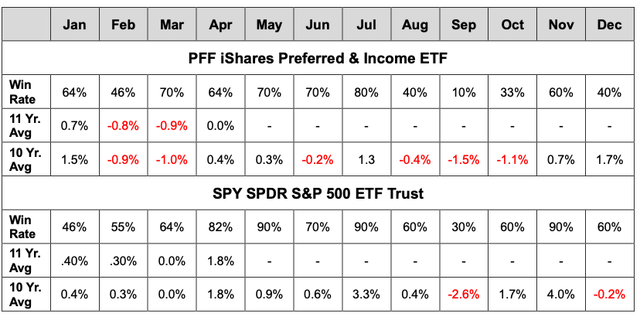
However, as per Table 4, Preferred Shares have not done so well in the second half of the year. Given that PFFD has not been in existence for the entire 10-year period analyzed, I have used PFF as a proxy.
PFF has underperformed SPY by 2% during July (1.3% versus 3.3%) and August, September and October have also been very bad months during the last 10 years.
Table 4: Monthly Returns – PFF versus SPY, 2014 to 2024
Seeking Alpha
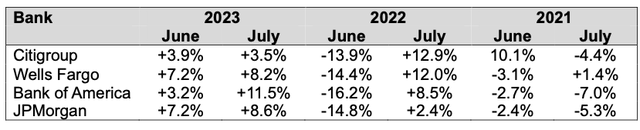
As per Table 3, the equity of most large banks has been flat in June over the last 10 years. However, this hasn’t been the case recently, at least not prior to last year.
Table 5: Monthly Data, June & July – 2021- 2023
Seeking Alpha
Citigroup, Wells Fargo, Bank of America, and JPMorgan collectively form a significant proportion of PFFD’s overall AUM. One would expect that a bad result on the Fed’s annual stress test would result in:
- Negative returns over the short term for the common equity of the affected banks.
- Increased credit spreads for the banks in question, and, if they are large enough, increased credit spreads for the banking sector in general.
- New issuance and increased supply of capital instruments such as preferred shares, as banks are forced to shore up their capital ratios.
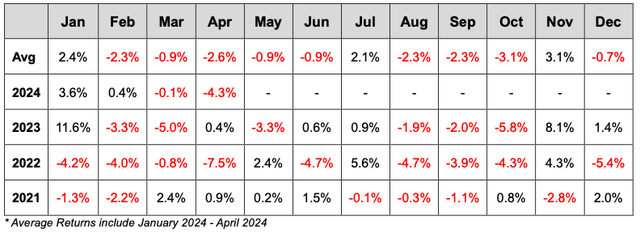
None of these are positive for preferred shares, and this is indeed what shows up in PFFD’s monthly returns over the past four years for the June to October time frame.
Table 6: Monthly Returns PFFD – 2021 to 2024
Seeking Alpha
During the years of 2021-2023, there have been 15 observations/months for the June to October time frame, five in each year.
- Ten of these fifteen months have had a negative return.
- Eight of these months have had a negative return of 1.1% or more, with six of these down months (or 40% of the months in question) showing losses of 2% or more, and five of them (33% of the total) showing losses of 3.9% or more.
- Only one month in fifteen, July 2022, had significant upside, 5.6%, although I guess June 2021’s return of 1.5% wasn’t something to turn your nose up at.
If you want to gamble on the results of this year’s Federal Reserve Stress Tests, holding PFFD doesn’t provide you with great odds, the upside is minimal, and the downside is considerable. Buying SPY would appear to be a better bet – nine of the last ten Julys have been positive months for it, and its average second half return was a 6.6% increase in price terms, with a further dividend yield of approximately 1% for the six month period.
If, on the other hand, you think markets are toppy, and you’re risk averse – go to cash. As per Section I, preferred shares rarely provide significant downside protection, and the Fed’s stress tests could give markets a reason, real or imagined, to sell off.
Ninety day T-Bills currently have an annual yield of 5.4%. PFFD’s annual dividend yield of 6.45% works out to an extra 1.05% over the course of 12 months, or 26 basis points (0.26%) over a 3-month time period. It’s not as if you’re going to lose out on any significant upside. If SPY were to rally by say, a further 25% in the next four months (not much chance of that In My Humble Opinion) and preferred shares were to get dragged along, issuers will start calling the preferred shares they have previously issued faster than you can shake a stick.
Conclusion
History shows that investors who own PFFD can expect; a) Minimal protection in a bankruptcy, b) No counter cyclicality to common equity and a similar market performance during extreme bear markets, c) Less income than common equity holders over the long term, d) A return that is similar to T-Bills, e) Returns that don’t keep up with inflation.
Since the Federal Reserve implemented annual Stress Tests for America’s largest banks, preferred shares have had worse second half total returns than in the first half of the year. This is particularly true of the last four years which have been characterized by extreme volatility in the months of June to October, with ten of these fifteen months being negative.
It’s always a good time to sell preferred shares and ETFs like PFFD, now just happens to be a better time than most. Accordingly, I rate the Global X U.S. Preferred ETF as a Strong Sell.
Credit: Source link








