
































Boy Wirat/iStock via Getty Images
Thesis
Ten months ago, we wrote an article on the Nuveen Floating Rate Income Fund (NYSE:JFR) and its absorption of other Nuveen leveraged loan CEFs. Our article talked about the benefits for the Nuveen platform achieved via this corporate action, and JFR’s forward as the marquee CEF from Nuveen in the leveraged loan space. We covered the name with a ‘Buy’ rating, and the fund has delivered:
Prior Rating (Author)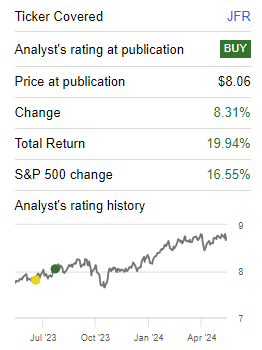
The vehicle posted a total return in excess of 19% since our rating, handily beating the S&P 500.
In today’s piece we are going to revisit the name in light of very tight corporate spreads and highlight why the CEF no longer presents an attractive entry point but is a name to hold for floating rate loan exposure.
Collateral composition – overweight single-B credits
The fund contains 457 names with a low duration of 0.22 years. While the majority of the portfolio is composed of floating rate loans, there is a small bucket for fixed bonds as well:
Fund Holdings (Fact Sheet)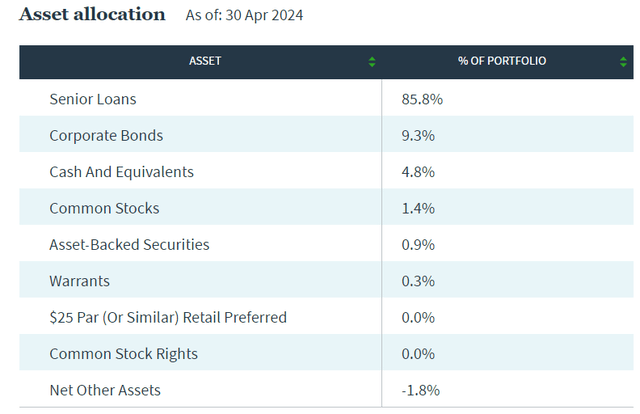
Corporate bonds currently represent 9.3% of the fund, with the rest of the allocations being extremely small.
The fund is focused on single-B credits, which represent more than 45% of the fund holdings:
Ratings (Fund Fact Sheet)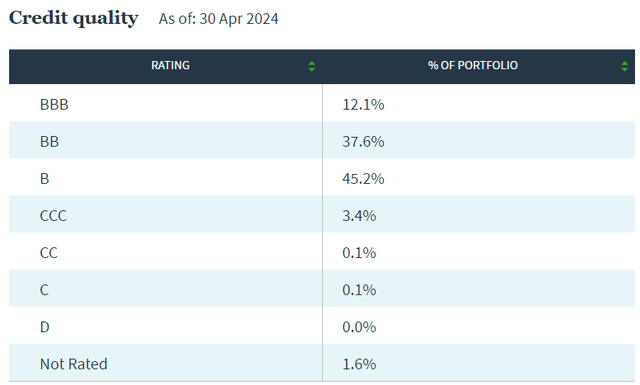
The vehicle has a very low allocation to the riskiest of credits, namely CCC-s, which make up only 3.4% of the CEF. Interesting to note a large allocation to BBB names, which is slightly unusual for high yield funds.
Analytics
- AUM: $1.2 billion.
- Sharpe Ratio: 0.36 (3Y).
- Std. Deviation: 6.7 (3Y).
- Yield: 11.6% (30-day SEC yield)
- Premium/Discount to NAV: -6%.
- Z-Stat: 1.66.
- Leverage Ratio: 37%.
- Composition: Leveraged Loans
Corporate spreads are too tight
As a rule of thumb, you want to buy fixed income when spreads are wide and sell it when spreads are very tight. JFR is a special case because it is composed of floating rate loans, which efficiently pass higher rates to investors. Nonetheless, the fund’s pricing is determined by risk-on environments in the market, with the current credit environment pricing only a soft landing:
Corporate Spreads (The Fed)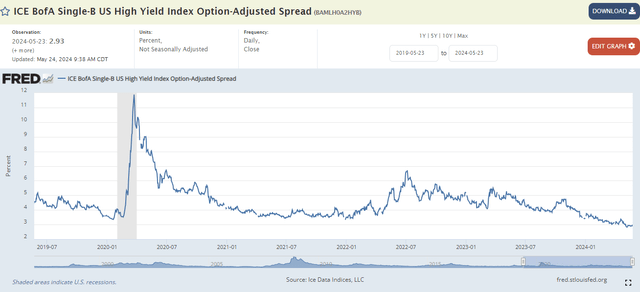
The above chart presents the ICE BofA Single-B US High Yield Index Option-Adjusted spread level, which is currently 293 bps. Please note, the current level is below the minimum achieved prior to the Covid pandemic. We are witnessing the tightest high yield spreads in the past five years.
We are not advocating for a hard landing in this article, but are purely pointing out that when spreads are at the bottom of the range, there is only one way they can be headed, and that is up. Whether it will be via a violent re-pricing or a slower grind, we are yet to see.
Morningstar analysts are also ringing the alarm bells on U.S. credit spreads:
However, even in our soft-landing scenario, we think corporate credit spreads have become too tight and should be underweighted. Over the past 24 years, only 2% of the time has the spread on the Morningstar US Corporate Bond Index been below the current spread of +86 basis points [and] only 3% of the time has the spread on the Morningstar US High-Yield Bond Index been below its current spread of +302 basis points. By way of comparison, the tightest investment-grade and high-yield credit spreads have ever traded is +80 and +241 basis points, respectively, in 2007.
Today’s spread level flashes red signs for investors looking to enter the space. An investor should not buy spreads here but wait for a re-pricing. JFR does a very efficient job of passing higher rates to investors, thus is a fund to hold, but no longer presents an attractive entry point.
There are times to buy the CEF, times to hold it, and times to sell. Currently, we are witnessing an environment which is still appealing to holding the name via higher risk-free rates, but an environment which no longer presents an attractive entry point.
Discount to NAV – a risk-on analytic
The CEF has seen its discount to NAV narrow by over 6% in the past six months:
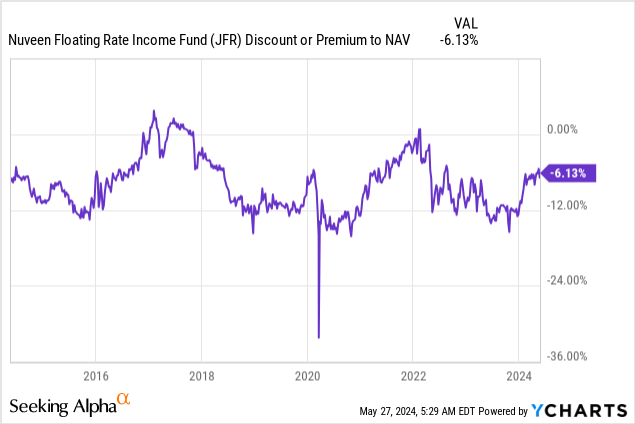
On average, the CEF is used to trade with a -12% discount to NAV, outside periods of market exuberance when the fund trades flat to its net asset value. We can see that ‘flat’ trading back in 2021, followed swiftly by a reversion to a large discount to NAV once the Fed started to introduce volatility via higher rates.
It is interesting to note that although the vehicle started yielding more on the back of higher rates, the market still priced the CEF as a risk-on vehicle, thus assigned it a larger discount to NAV starting in 2022. Expect this behavior to continue. The CEF will experience another widening of its discount during the next risk-off event.
Distribution coverage is very good
JFR continues to be a fund to hold via its very large dividend yield, which is almost entirely supported:
Distribution Coverage (Section 19a)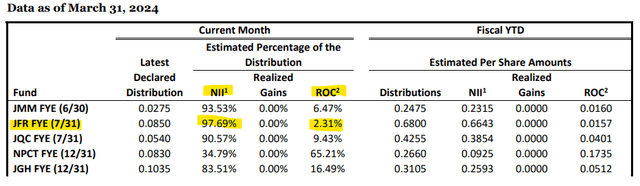
As of the March 2024 Section 19a notice, the CEF utilizes only a very small 2.3% figure as ROC, indicating a name which does not over-distribute. A higher rates environment, combined with a high leverage ratio for the CEF, is responsible for the high dividend yield generated by this fund.
As long as rates stay high, the fund will continue to do a good job of passing that on to investors, thus our hold rating on the name. One does nonetheless have to be mindful of the fund’s leverage and understand that in risk-off scenarios, the vehicle will fall more than unleveraged vehicles like ETFs in the lev loan space.
Conclusion
JFR is a leveraged loan CEF. The fund now represents the marquee Nuveen offering in the leveraged loan space and comes with an 11.6% yield. The CEF has delivered a total return close to 20% since its merger with other Nuveen loan CEFs and is now overextended in a very tight credit spread environment. The positive move in the fund has also been helped by a 6% narrowing of its discount to NAV, which functions as a risk-on financial analytic. With single-B spreads at five year lows, today’s environment is no longer attractive to buy JFR, but the CEF still represents a fund to hold via its very high and supported dividend yield. We are therefore moving from ‘Buy’ to ‘Hold’ on the name.
Credit: Source link