

imagestock
The iShares S&P Small-Cap 600 Growth ETF (NASDAQ:IJT) is a passively managed vehicle targeting a growthier portion of the U.S. small-cap universe. I have been covering this ETF since March 2023, with a note presented back then having a slightly pessimistic tone, as my primary concern was related to the market narrative dominated by hawks, something that boded ill for the growth-chasing strategy.
It seems my concerns were justified. The year was a rollercoaster for the ETF, as it declined by almost 3% in April, then, after a mostly bullish May-July period, it was falling for three months in a row, only to rebound solidly as the narrative switched in autumn. So, primarily thanks to market-wide enthusiasm tied to expectations for an interest rate cut in 2024, it ended 2023 confidently in the green with a 17.1% total return. Nevertheless, it has underperformed the S&P 500 since the previous article.
Seeking Alpha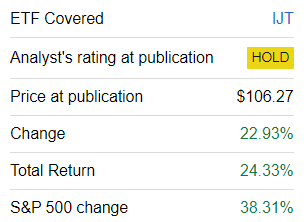
Today, I am offering an update principally due to two reasons:
- IJT has seen its portfolio deeply recalibrated, with the current version having less than 60% overlap with the holdings as of March 7, 2023, which means there should be notable shifts in the factor story worth discussing. They, in turn, might be material to the thesis.
- The market narrative is now different from that in March 2023, in part thanks to the AI theme and also since inflation data are once again supportive, or at least are interpreted as such by an overweening majority of market participants. So, we should address the question of whether IJT is an optimal choice to benefit from this bull market or not.
What is the basis for IJT’s strategy?
To recap, IJT has a fairly straightforward strategy based on the S&P SmallCap 600 Growth Index. With the S&P 600 being the selection universe, the index targets companies that sport desirable growth and momentum characteristics. As described in the prospectus available on the IJT website, to identify which companies might qualify and which might not, three parameters are used, namely
… three-year change in earnings per share over price per share, three-year sales-per-share growth rate and momentum (12-month percentage share price change).
Importantly, this is not a perfectionist strategy designed to cut all the small-caps with value characteristics off. It has a more middle-ground approach, so some overlap between IJT and the iShares S&P Small-Cap 600 Value ETF (IJS) should not raise eyebrows.
Another important remark here is that the same index is tracked by the Vanguard S&P Small-Cap 600 Growth ETF (VIOG) and the SPDR S&P 600 Small Cap Growth ETF (SLYG). The table below shows the differences in AUM and expense ratios:
| ETF | Expense ratio, bps | AUM, $ billion |
| IJT | 18 | 5.82 |
| SLYG | 15 | 3.19 |
| VIOG | 15 | 0.855 |
What vulnerabilities does IJT currently have?
In my view, IJT’s portfolio is imperfect on the valuation, profitability, and even growth fronts. There is something to dislike about its past performance as well. Let’s discuss all these in turn.
Issues with growth exposure
As of May 22, IJT had 346 equities in its portfolio, with the primary ten accounting for around 11.3%. The first issue I see in this portfolio is its somewhat weak weighted-average forward revenue growth rate at just 6.7%, as per my calculations. For context, the iShares Core S&P 500 ETF (IVV) has that figure above 10%, which I discussed in the recent article on the Fidelity Quality Factor ETF (FQAL). I have identified a few culprits for that. For example, IJT made fairly questionable choices in the industrial and consumer discretionary sectors, as illustrated by the average growth rates in the table below:
Created by the author using data from Seeking Alpha and IJT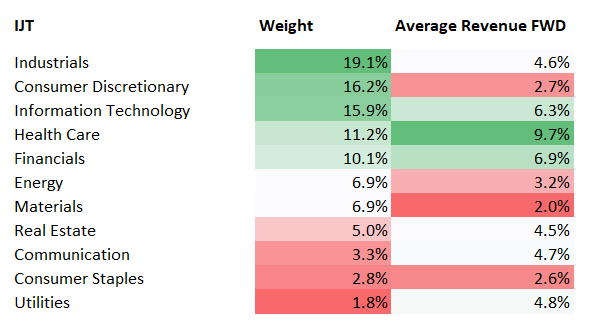
Also, I have found out that about 17.5% of IJT’s holdings are forecast to deliver lower revenues going forward. In my view, this is unacceptable for a growth factor ETF.
Next, the ETF does have an impressive WA forward earnings per share growth rate of 12.2%, as per my analysis. However, the rate is bolstered chiefly by the following companies:
| Stock | Weight | Sector | EPS Fwd |
| Helmerich & Payne (HP) | 0.33% | Energy | 234.93% |
| Abercrombie & Fitch Co. (ANF) | 1.19% | Consumer Discretionary | 221.46% |
| SPX Technologies (SPXC) | 1.08% | Industrials | 134.61% |
| Viad (VVI) | 0.12% | Industrials | 122.26% |
Data from Seeking Alpha and IJT
At the same time, pundits forecast EPS to contract for 23% of the holdings. With them as well as the four outliers removed, the WA figure is at 10.3%, which is healthy, but it is still not great for a strategy like that.
And last but not least, just 48% of the companies have a B- Quant Growth rating or higher. This is one of the main issues that weigh on my rating.
Valuation risks
As I have already explained in the March 2023 article, IJT has a SMID portfolio. And as of May 23, it had a WA market cap of $3.56 billion, which clearly illustrates that the basket is heavy in mid-caps. To be precise, small-caps account for less than 19% of the net assets. However, this is not the key issue here. The problem is that close to half of the holdings have a D+ Quant Valuation grade or lower. I find this expensiveness worthy of concern even despite the mix having a rather healthy adjusted earnings yield of 5.7% (calculated with negative figures removed).
Quality concerns
In my previous note, I said that IJT’s quality characteristics were “comparatively strong by small-size equity universe standards.” That is still relevant. However, this certainly does not immediately imply they are supportive of a rating upgrade. Below are the main facts to consider.
- IJT has 66.5% of the net assets parked in stocks with a B- Quant Profitability grade or higher. For clarity, this is not too small, but it is certainly not bullish, as I favor portfolios with an at least 80% allocation regardless of the equity echelon targeted, be it a small, mid-, or large/mega-cap group. This is especially important now, as the era of high interest rates has obviously not ended yet, and high-quality companies can navigate it easier than their low-margin counterparts.
- The weighted-average adjusted net margin (with 8.7% of the loss-making holdings removed) is rather small at just 13.3%.
- Next, it has too many levered FCF-negative companies in the portfolio. They account for 18.4% of the portfolio.
- Return on Assets and Return on Equity are mostly just average. For example, ROA is at 6.5%, meaningfully below a 10% level I consider desirable. The adjusted ROE (with negative and three- and four-digit figures removed) stands at 16.3%. This is acceptable, but I would prefer to see at least 20%.
IJT’s performance is nuanced
Incepted in July 2000, over the August 2000–April 2024 period, IJT beat IVV with ease. However, the iShares Core S&P Small-Cap ETF (IJR) was racier.
| Metric | IJT | IVV | IJR |
| Start Balance | $10,000 | $10,000 | $10,000 |
| End Balance | $75,723 | $54,880 | $81,442 |
| CAGR | 8.90% | 7.43% | 9.23% |
| Standard Deviation | 19.25% | 15.35% | 19.61% |
| Best Year | 42.26% | 32.30% | 41.32% |
| Worst Year | -33.38% | -37.02% | -31.52% |
| Maximum Drawdown | -51.05% | -50.78% | -51.79% |
| Sharpe Ratio | 0.46 | 0.44 | 0.47 |
| Sortino Ratio | 0.67 | 0.63 | 0.69 |
Data from Portfolio Visualizer. The period is August 2000–April 2024
This is something I have already discussed in the previous article. However, there are two major issues not to miss here. First, a bigger story is that its outperformance was driven mostly by its returns in 2001, 2004, 2010, and 2013, with 2010 being especially robust as it beat IVV by a massive 13.15%.
| Year | % outperformance |
| 2001 | 10.18% |
| 2004 | 10.38% |
| 2010 | 13.15% |
| 2013 | 9.96% |
Calculated using data from Portfolio Visualizer
But with the period reduced to 10 years, its annualized return no longer looks that bright, as it actually underperformed IVV.
| Metric | IVV | IJT | IJR |
| Start Balance | $10,000 | $10,000 | $10,000 |
| End Balance | $32,074 | $23,877 | $22,470 |
| CAGR | 12.36% | 9.09% | 8.43% |
| Standard Deviation | 15.23% | 19.46% | 20.22% |
| Best Year | 31.25% | 22.37% | 26.61% |
| Worst Year | -18.16% | -21.32% | -16.19% |
| Maximum Drawdown | -23.93% | -32.91% | -36.12% |
| Sharpe Ratio | 0.75 | 0.47 | 0.43 |
| Sortino Ratio | 1.17 | 0.7 | 0.64 |
Data from Portfolio Visualizer. The period is May 2014–April 2024
Second, with IVV selected as a benchmark, its downside capture ratio was 111.84%, which means that it was much more vulnerable to bearish forces that the S&P 500 ETF, probably owing to its smaller exposure to high-quality companies.
| Metric | IJT | IJR |
| Upside Capture | 96.72% | 96.47% |
| Downside Capture | 111.84% | 113.67% |
Data from Portfolio Visualizer. The period is May 2014–April 2024
Does IJT deserve an upgrade today?
IJT is a low-cost vehicle with substantial AUM and a fairly long trading history, dating back to 2000. It has multiple advantages, including its appealing weighted-average EPS growth rate (obviously, with nuances) and alpha delivered since its inception. However, there are a few concerns on performance as well as factor (growth, quality, and valuation) fronts that, when put together, significantly weigh on the rating.
I believe the market narrative is now more supportive of the growth style than it was in March 2023. However, the legitimate question worth asking here is whether it makes sense to venture into the SMID universe and compromise on profitability and capital efficiency to receive a revenue growth rate that is 1.5x lower than that of IVV. I doubt that. Thus, I believe IJT is still a Hold.
Credit: Source link