

AlxeyPnferov
ETF Profile
The iShares MSCI Japan ETF (NYSEARCA:EWJ), one of the oldest foreign ETFs around (28-year history), offers coverage to over 200 large-and-mid-cap Japanese stocks. Even though EWJ’s expense ratio of 0.5% is not the most competitive around, it is still perceived to be the “go-to” option for those seeking diversified equity exposures to Japan. This is exemplified by the total AUM it has accumulated over time (over $16.5bn), which is greater than the aggregate AUM of the next two largest Japanese ETFs (BBJP and DXJ). Investors could likely appreciate EWJ’s extremely stable portfolio, where the annual churn is virtually non-existent (only 3% last year)
Corporate Japan’s increased generosity with dividend payouts has been well-published off late, and this has translated well to EWJ’s own payout profile. EWJ has been doling out semi-annual payments for 15 years now (prior to that from 2000, it was annual payouts), and last year the YoY growth in total dividends was quite astronomical at 95%! As a result, at current prices, you get a fairly handy yield of 1.89%, which is around 25bps more than what the ETF has yielded over the last 4 years on average.
Macro Commentary
The Japanese economy isn’t in the best of health, and that was reiterated by the Q1 GDP numbers which came in today, well below what the street was expecting.
Reuters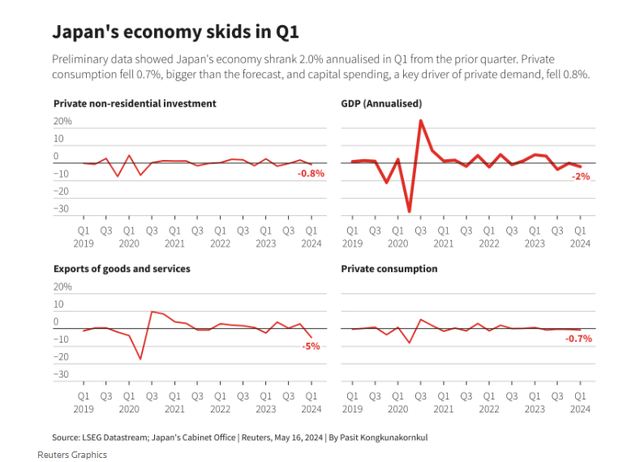
Essentially, the economy ended up contracting by -2% on a qoq basis, whilst the street was only budgeting for a -1.5% decline. Worryingly, Q4 GDP too was revised downwards, mainly due to weak CAPEX spending.
A weak CAPEX backdrop reflects poorly on the prospect of EWJ as it is dominated by large industrial stocks. One shouldn’t be overly surprised that there is limited desire to engage in CAPEX when Japanese industrial production growth has been on a slump for 8 out of the last 9 months. Worryingly, the pace of declines has been worsening over the past 4 months, with March IP declines coming in at a particularly pronounced rate of -6.1%.
Trading Economics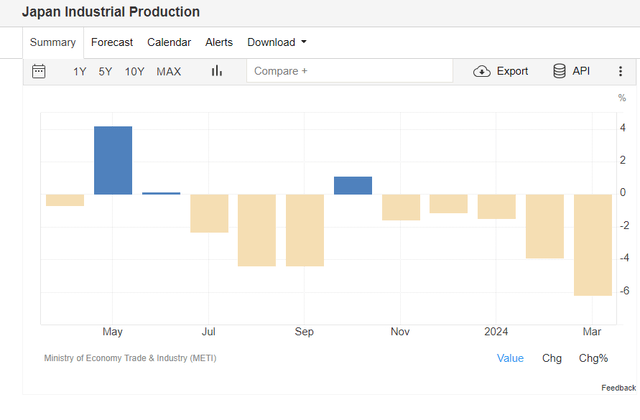
Whilst these large industrials face topline pressure, one is also likely to see increased pressure on the cost base, given the steep cost of imported raw materials (a corollary of the relentless yen depreciation), as well as a potentially higher labor expense bill. Note that last month, there was also an agreement to hike wages by 5.24% this year (the largest annual increase in 33 years).
Considering all this, it is no surprise to discover that the BoJ’s Tankan index, which gauges business confidence of large manufacturers dropped to 11 in Q1 (the first time in a year). Also the expectation for Q2 is an even lower reading of 10.
Trading Economics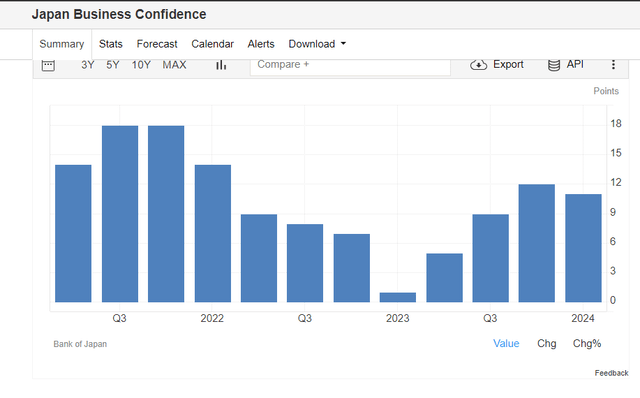
Investors also need to recognize that the pronounced yen depreciation is also making imported consumer goods quite costly, and thus also putting a spanner in the works on private consumption, which accounts for half the Japanese economy. Now given the weak GDP reading, it looks highly doubtful that the BoJ will be in any rush to follow on from the rate hike seen in March, likely putting further pressure on the Yen.
Already over the past year, EWJ has lagged its currency hedged counterpart (HEWJ) by over 2.6x and with no further rate hikes in the cards, we could see this degree of underperformance linger.
YCharts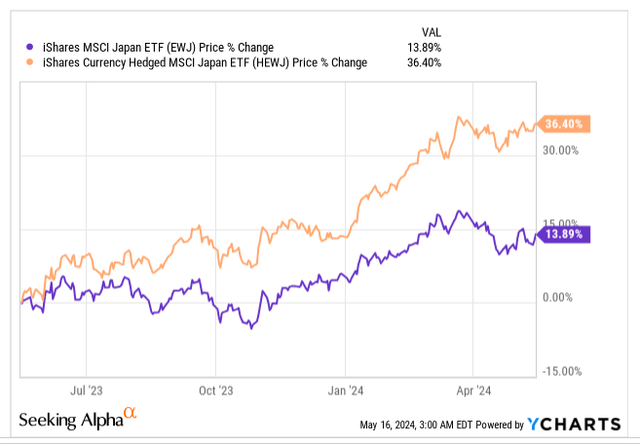
Closing Thoughts – Valuation and Technical Commentary
Besides the unsteady macro backdrop, even the current valuation and technical sub-plots don’t necessarily raise EWJ’s allure as an investment proposition at this juncture.
As per Morningstar data, EWJ’s holdings are now priced at a relatively steep P/E of 15.8x. In contrast, a portfolio of developed market stocks (VEA) or even a portfolio of small-cap Japanese stocks (SCJ), with an average market cap of less than $2bn, can be picked up at P/E discounts of 15-18% relative to EWJ.
Morningstar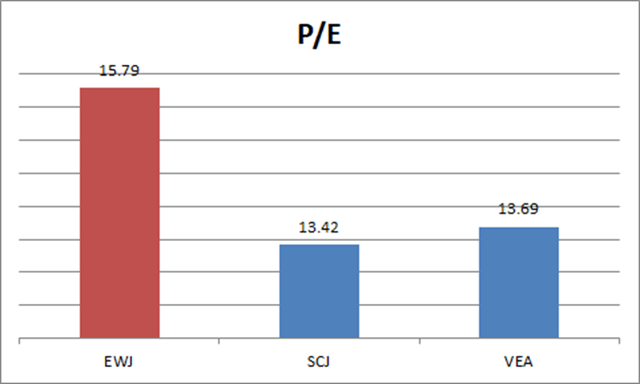
Then the chart below helps explore if EWJ’s holdings could potentially benefit from rotational interest from those looking at beaten-down opportunities in the developed market space. For that condition to burn bright, one would need to see the relative strength ratio trending way below average at the bottom half of the chart. However, what we have now is a situation where the RS ratio is around 7% higher than its long-term average.
YCharts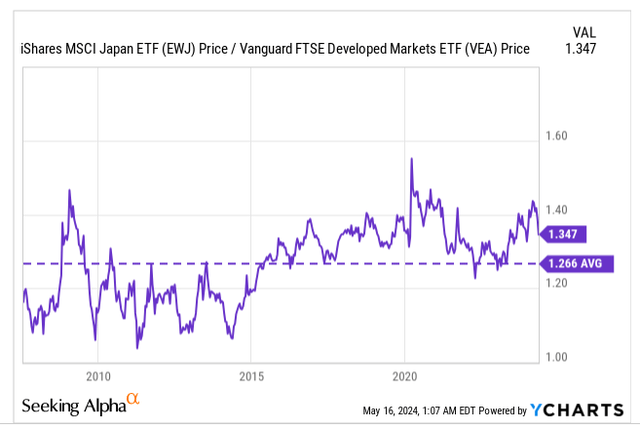
Similar dynamics can be felt whilst gauging the Japanese large-and-mid-cap to small-cap ratio, which is now around 9% higher than its long-term average (thus dampening rotational interest towards EWJ’s holdings).
YCharts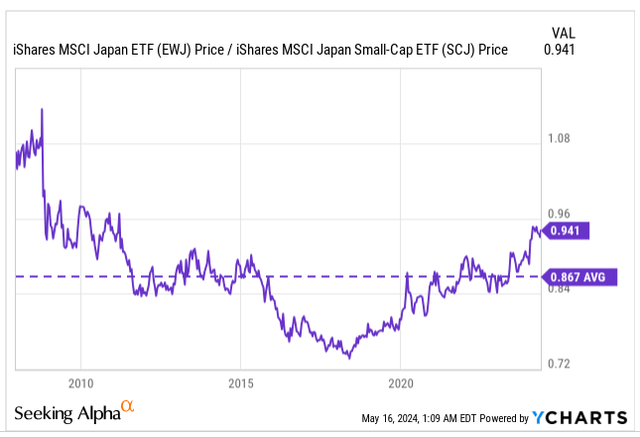
It’s also worth keeping an eye on net flow movements towards EWJ across time, and given how the second half of April (there haven’t been any weekly flows since the second week of April), and May is going so far, it suggests that interest towards this product has cooled. For context, over the last 12 months (as of 16th May), EWJ has managed to accumulate net positive flows to the tune of $4.46bn, averaging around +$370m per month. With almost three weeks of May completed, we have yet to see any weekly outflows.
ETF.com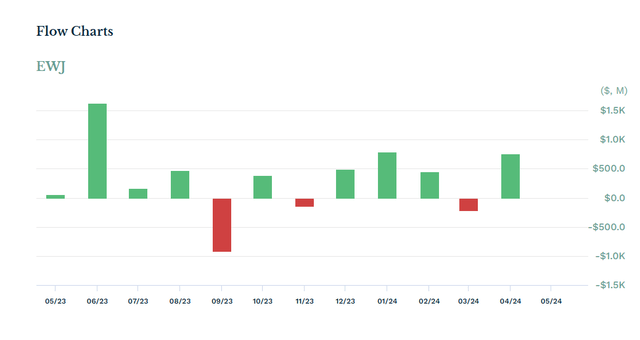
Finally, developments on EWJ’s standalone weekly chart don’t make us too bullish now either. Essentially since, the second half of 2022 till now, EWJ has trended up in the shape of an ascending channel. You ideally want to get into EWJ when it is perched closer to the lower boundary of the channel. At the current share price of $68.97, the distance towards the upper boundary is a lot closer than the distance with the lower boundary, translating to sub-optimal reward to risk (r:r) of only 0.7x (whilst entering, you ideally want your r:r to be above 1x).
Investing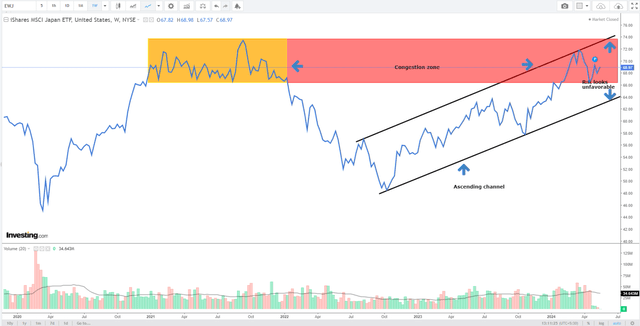
The other thing to note is that EWJ has now reached a price terrain which had previously served as a congestion zone across the whole of 2021 (area highlighted in yellow). Given the historical connotations of this price range, we wouldn’t be surprised to see EWJ drift sideways for the foreseeable future. To conclude, EWJ is a HOLD at current levels.
Credit: Source link