Vivek Vishwakarma
The current market remains a ‘target rich’ environment for income investors, with many stocks yielding well above the key 3% psychological mark. While it’s tempting to pile money into Treasuries that now yield around 5%, one should question for how long that yield may last, considering that the weaker-than-expected April Jobs Report builds a case for rate cuts this year.
As such, buying Treasuries carries reinvestment risk, in which interest income may not be deployed at similar yields and risk from opportunity cost, in which the investor could miss out on share price gains and higher dividends in the equity market.
This brings me to the following 2 picks, both of which yield well above the S&P 500 (SPY), are different enough from one another such that one doesn’t need to worry about concentration risk. One offers immediate high yield with value and the other offers solid dividend growth, in-sector diversification, and value, so let’s get started!
#1: Omega Healthcare Investors – 9% Yield
Omega Healthcare Investors (OHI) is the largest pure-play owner of skilled nursing facilities. It has 866 properties spread across 42 U.S. states and the U.K., and is diversified across 73 operators.
OHI has come a long way over the past 4 years, from being a safe haven in the early pandemic timeframe due to the government-pay nature of its properties to seeing tenant struggles as occupancy, labor shortages, and wage inflation have weighed on the sector.
Management has demonstrated skill in navigating through this environment through a combination of working with operators, transition of leases, and asset dispositions. This, combined with an overall industry recovery, has helped portfolio metrics.
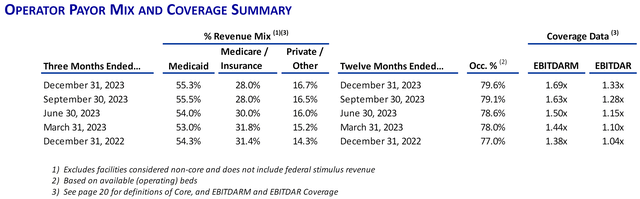
This is supported by the following chart, which shows operator occupancy and rent coverage improving over the past 12 months (note: tenant metrics are reported 3 months in arrears).
Investor Presentation
Improved tenant rent coverage enabled OHI to Achieve AFFO growth of $0.02 YoY to $0.68 for Q1 2024, results of which were reported on May 2nd. Also encouraging, Funds Available For Distribution (FAD) improved by $0.05 YoY to $0.65.
While OHI’s FAD still does not cover OHI’s quarterly dividend rate of $0.67, I see potential for coverage continue its upward trajectory. This is considering the aforementioned improvements in rent coverage, with Q1 EBITDAR-to-rent coverage improving to 1.42x.
Management is guiding for full-year 2024 AFFO per share of $2.75 at the midpoint of the range, and for the Dividend-to-FAD payout ratio to improve from 103% at present to the mid-90% range in the upcoming quarters. This could also be supported by $55 million in new investments completed during Q1.
Meanwhile, OHI’s balance sheet remains strong with a BBB- credit rating. This is supported by a reasonably low net debt-to-EBITDA ratio of 5.0x, solid fixed charge coverage ratio of 3.9x, 99% fixed rate debt, and $1.76 billion in total liquidity.
Risks to OHI include a handful of operators that are now accounted for on a cash basis, which makes full-year AFFO and FAD difficult to predict. In addition, the Centers for Medicare Services issued a rule that will be effective in 2 years, requiring a higher number of hours for on-site Registered Nurses from 3.0 to 3.48, which would increase labor costs. As such, it’s worth monitoring how OHI’s operators will navigate reimbursements going forward to cover the higher cost.
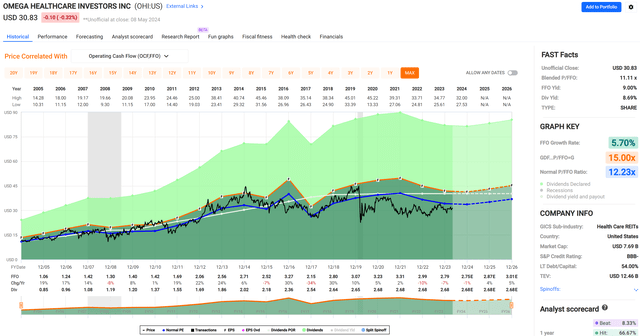
Lastly, I continue to see value in OHI at the current price of $30.83 with a forward P/FFO of 11.3, sitting below its historical P/FFO of 12.2, as shown below.
FAST Graphs
While OHI is trading 8% higher than when I last visited the stock in May of last year, I believe the improved valuation is justified considering the improvements in tenant rent coverage over that time.
Analysts estimate 3-6% annual FFO/share growth in the 2025-2027 timeframe, which, I believe, is reasonable considering overall drivers from the aging population and improved stability and occupancy in the SNF segment. As such, I believe OHI represents good value at the present 8.7% dividend yield with potential for share price appreciation to its historical P/FFO with continued improvements in its portfolio.
#2: XLE – 3% Yield
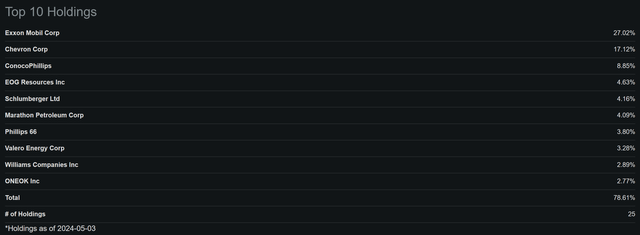
The Energy Select Sector SPDR ETF (XLE) is an exchange-traded fund that invests in a swath of energy companies across Oil and Gas. Its top 3 holdings are integrated energy giants Exxon Mobil (XOM), Chevron (CVX), and ConocoPhillips (COP) which together comprise just over half (53%) of the total portfolio.
As shown below, the rest XLE’s Top 10 holdings are comprised of oil field services giant Schlumberger (SLB), refining giant Phillips 66 (PSX), and natural gas midstream giants Williams Companies (WMB) and ONEOK (OKE).
Seeking Alpha
XLE isn’t going to create any quick millionaires on its own, as its underlying characteristics are vastly different from the high growth trajectories of tech-heavy indices Invesco QQQ (QQQ) or the S&P 500. However, given the value characteristics of the overall energy sector, it could serve as a solid counterweight against risks from overvaluation in the tech sector.
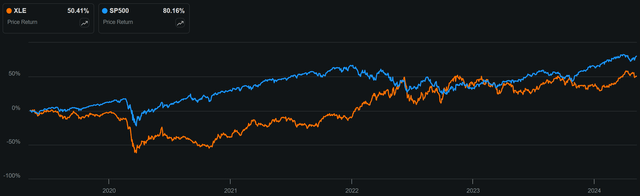
This is demonstrated by the following chart, which shows that while XLE underperformed the S&P 500 over the trailing 5 years, it demonstrated higher returns in 2022 during the tech fallout, when the market rotated out of growth stocks and into value stocks such as those in the energy sector.
XLE vs. SPY 5-Yr Price Return (Seeking Alpha)
Looking ahead, the energy sector should continue to benefit from high crude oil prices. This is supported by recent Q1 2024 earnings from XOM, which is XLE’s biggest holding, showing that it achieved $14.7 billion in operating cash flow and achieving 600K barrels per day of oil production in the newest energy-rich producing country of Guyana.
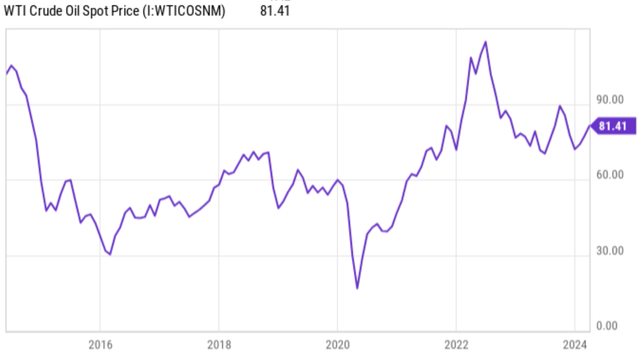
This is supported by WTI Crude sitting at $81.41 per barrel at present, which is materially higher than where oil traded in the 2015-2021 timeframe, as shown below.
YCharts
In addition, recent trends around the growth of AI means that power hungry data centers will need more energy and not less. This is reflected by the most recent Q1 2024 earnings call from natural gas pipeline operator Kinder Morgan (KMI), in which the CEO remarked seeing increasing demand from Cloud/AI data centers.
Importantly for income investors, XLE currently sports a 3.1% dividend yield, which is more than double that of the S&P 500. It also carries a 5-year dividend CAGR of 7.1%, which is meaningfully higher than the 5.1% 5-year CAGR of SPY.
Investors may also benefit from SPY’s low expense ratio of 0.09%, sitting far below the 0.48% across the ETF Universe, thereby resulting in an ‘A’ expense grade from Seeking Alpha.
Risks to XLE include potential for higher-than-expected displacement of traditional fossil fuels from renewable energy sources. In addition, the energy sector is cyclical by nature, and is sensitive to macroeconomic downturns should that result in decreased demand (albeit temporarily) for energy.
Considering all the above, I believe XLE can serve as a great portfolio hedge against a tech-heavy portfolio, as XLE’s top 2 holdings (44% of portfolio total) XOM and CVX both trade at forward PE of under 13x, comparing favorably to the +20x PE of many top holdings in the S&P 500 like Google (GOOG) and Apple (AAPL). In a tech downturn, investors could benefit from a sector rotation into energy, all while collecting a solid dividend yield.
Investor Takeaway
While the market is currently at all-time highs and some may be hesitant to invest in stocks versus Treasuries, plenty of opportunities remain among dividend stocks. By considering a mix of dividend-paying stocks that are undervalued and has potential for growth, such as OHI and XLE, investors can mitigate risk and potentially see solid returns over time. With yields ranging from 3-8%, both stocks could be a welcome addition for portfolio diversification and yield.
Credit: Source link