

outline205
The U.S. Federal Reserve made a critical announcement last week, communicating its plan to slow its quantitative tightening program from June. The announcement acts as a leading indicator, suggesting an interest rate pivot is near. However, the subsequent reaction in the bond market was mixed and matched, implying that investors don’t quite know whether or not to buy into the Fed’s narrative.
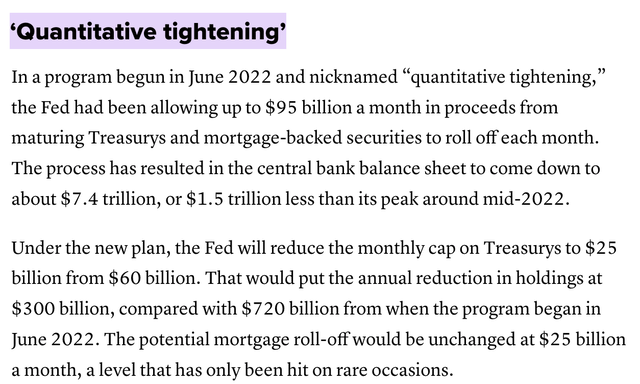
The Fed’s Announcement (CNBC)
Two vehicles that might be influenced by the volatile bond yield environment are the iShares 5-10 Year Investment Grade Corporate Bond ETF (IGIB) and the iShares 1-5 Year Investment Grade Corporate Bond ETF (NASDAQ:IGSB). We initially decided to cover the IGSB ETF as a follow-up to our coverage last year. However, we wanted to throw IGIB into the mix to extend the analysis.
Today’s aim is to establish which ETF is the most suitable for today’s market. So, without further ado, let’s start the analysis.
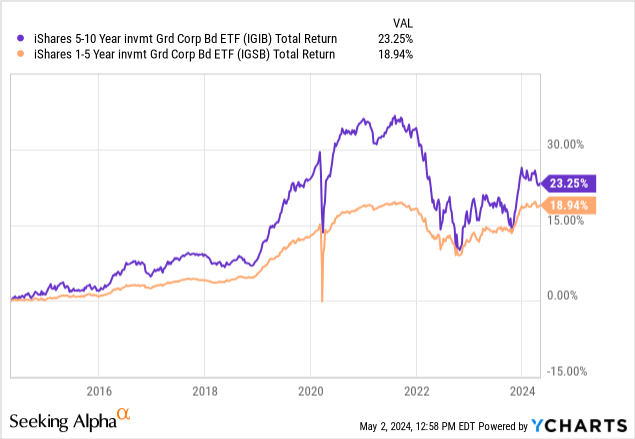
Differentiating Factors
Let’s start by differentiating the two ETFs from a behavioral vantage point.
As you’ll see below, I collated the two ETFs’ key data and added them side by side. The image is small, so please click on it to enlarge the data set.
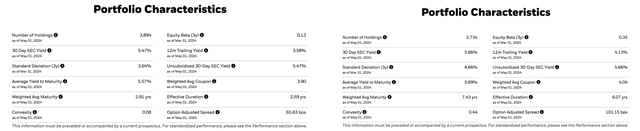
Click on Image To Enlarge (iShares)
As shown, IGSB has an effective duration of 2.59 years, while IGIB has an effective duration of 6.07 years. A bond vehicle’s effective duration is the option-adjusted sensitivity to a 1% parallel change in interest rates – interest rates and corporate bond valuations are inversely related.
The longer duration of IGIB suggests it has more interest rate sensitivity than IGSB, but what about other influencing variables? Well, to our knowledge, investment-grade corporate bonds are influenced by interest rates, credit migration, and credit risk – interest rates and credit migration are usually the main influencing variables. Moreover, convexity plays a role in option-embedded bonds, as it proliferates bond gains and limits bond losses.
Key data suggests the aforementioned variables contribute to IGIB and IGSB. However, their contributions aren’t equal. As already mentioned, IGIB likely possesses more interest rate risk than IGSB. Additionally, IGIB has an option-adjusted spread of 101.15 basis points, whereas IGSB has an option-adjusted spread of 65.63 basis points. The OAS measures option-adjusted credit risk (including a probability of default and liquidity), which means that IGIB likely has excess credit spread risk.
Furthermore, IGIB has a convexity of 0.44 while IGSB has a convexity of 0.08, suggesting IGIB has greater downside protection and upside potential on this basis alone.
The following diagram from AnalystPrep illustrates the basic components of a corporate bond price change. Effective duration can be substituted in place of modified duration to account for bond optionality.
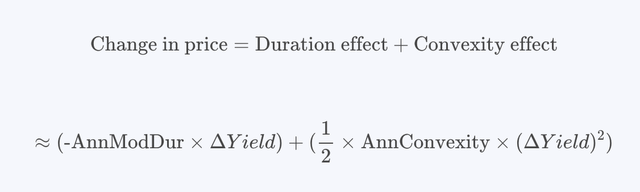
Analyst Prep
The prior formula is quite commercialized but neglects credit risk, which I phased into the formula below. I’m quite confident about our theoretical knowledge at Pearl Gray; nonetheless, understand that the formula is our own and may not be uniform among investors.
| Price Change = ( – EFF Dur x Change in R) + (0.5 x Convexity x Change in R^2) + (PD x LGD) |
Source: Author’s adjustment
Symbols: R = Time-Relevant Yield; PD = Probability of Default; LGD = Loss Given Default
If you look at IGIB and IGSB’s numbers and the first formula, it should be clear that interest rates have a dominant effect. However, our formula includes credit risk, which can be measured via the OAS for both ETFs. As mentioned above, IGIB has a higher credit spread than IGSB by about 35 basis points. Testing the sensitivity of these spreads is beyond the scope of this article. However, we’ll fall back on our theoretical knowledge, which stresses that credit risk plays a minor role compared to interest rate shifts for investment-grade corporate bonds.
Lastly, as mentioned before, credit migration has a substantial influence on corporate bonds. As with credit risk, establishing sensitivity is arduous. Thus, we’ll look at it qualitatively in this instance.
Market Outlook
Price Action: Interest Rates
Our first point of discussion regarding our outlook is interest rates. The image below suggests that market participants expected a rapid decrease in interest rates a month ago. However, recent CPI and PPI reports (link here) communicate a resistance level within the real economy. It’s almost as if the Fed knew it had to raise policy rates by more than it has but wished inflation would magically settle lower.
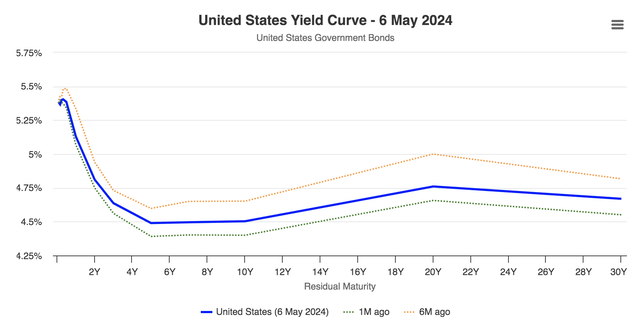
worldgovernmentbonds.com
We anticipate ongoing interest rate uncertainty in the coming quarters. Although we usually bank on a natural credit cycle (see below), times seem different. As such, we think reducing duration with IGSB ETF would be a smarter move than increasing duration with IGIB ETF.
Moreover, an interest rate pivot would likely steepen the slope of the yield curve, leading to much lower short-term yields and sustained long-term yields. Sure, the opposite could occur, whereby the Fed hikes and further inversion occurs; however, we think a flattened curve or steepened curve remains more likely.
Price Action: Credit Migration & Credit Risk
Sectors
Both of these ETFs have a few thousand holdings in their portfolios. Therefore, discussing each issuance in detail is counterproductive. In our view, a sectoral analysis is more important.
The chart on the left shows the exposure of IGIB ETF, whereas the chart on the right shows the exposure of IGSB. A discussion follows.
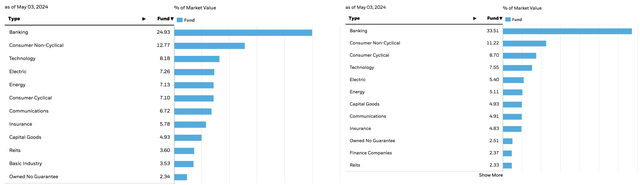
Sectoral Exposure – Click To Enlarge (iShares)
Both ETFs are led by banking exposure. However, IGIB has less banking exposure, which we like for two reasons. First, it reduces concentration risk. Second, banks are in an uncertain environment due to fluctuating implied interest rates and pending amendments to capital adequacy requirements.
Both ETFs have more than 10% exposure to non-cyclical consumer stocks, which we think is good in today’s uncertain economic environment because non-cyclical stocks are “throughout the cycle” assets. Furthermore, we like IGIB’s 15%+ exposure to technology and electric from a long-term vantage point; however, we think interim risks might surface.
The following figure illustrates a time series of non-financial sector U.S. interest coverage ratios. A sharp slide occurred in early 2022 when interest rates rose abruptly. Nevertheless, a flatline
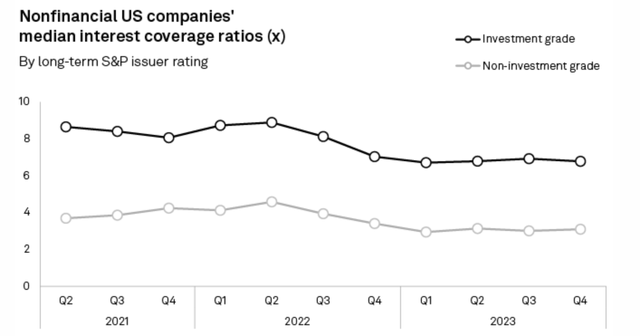
S&P Global
Credit Quality
A credit quality-based argument forms an interesting juxtaposition. The top part of the next diagram presents IGSB’s credit quality exposure, while the bottom part expresses IGIB’s credit quality exposure.
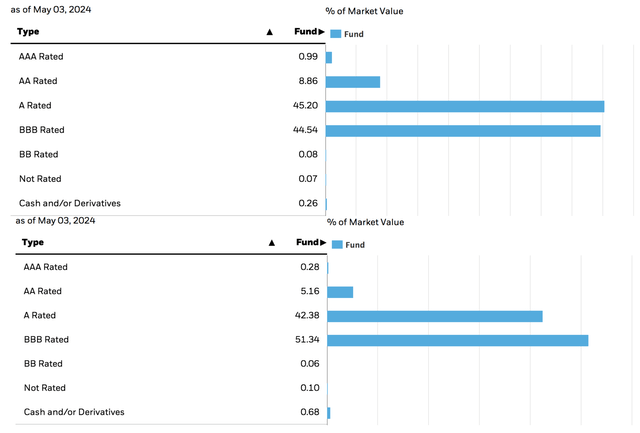
Credit Quality Exposure – Click to Enlarge (iShares)
IGIB ETF’s credit rating exposure shows that it has more exposure to BBB assets, whereas the majority of IGSB’s exposure is A-rated and above. We prefer IGSB’s exposure as it introduces less credit risk. As mentioned before, our knowledge tells us that investment-grade bonds aren’t as much influenced by credit risk as interest rates, but BBB bonds are borderline investment-grade. As such, we think IGIB might fluctuate alongside credit spreads.
Although credit risk premiums in the U.S. have remained low since spiking during last year’s mini banking crisis, we expect the opposite to occur in the second half of 2024. As mentioned in the introduction, the Fed is ready to soften its tightening program, which provides a leading indicator of an interest rate pivot. Theoretically, a rate pivot would spike credit spreads, as the two are usually negatively correlated. Moreover, we think the economic cycle is set for a natural slowdown, in turn raising the probability of higher credit risk premiums.
With these predictions in mind, we prefer IGSB ETF’s higher credit quality exposure.
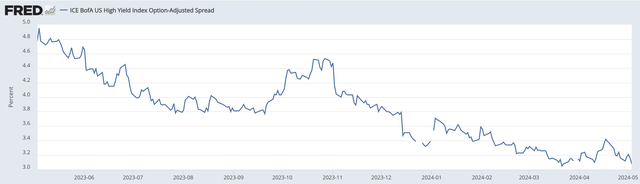
U.S. OAS (St. Louis Fed)
Dividends
An analysis of IGIB and IGSB’s dividends is extremely interesting. The first issue to point out is that the two ETFs have similar trailing dividend yields. However, panel data shows that IGIB has shed a lot of value since 2022, meaning much of its yield is price-induced.
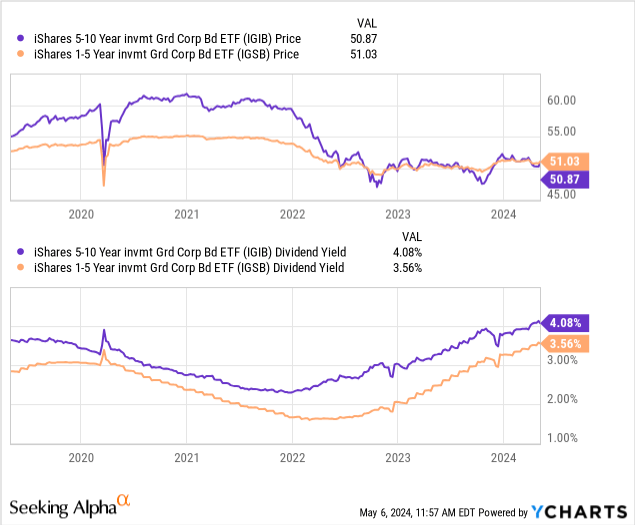
We think both ETFs provide excellent dividend opportunities, especially for investors looking to cover monthly liabilities (both ETFs distribute monthly). Due to its higher duration, IGIB’s dividends will probably be more cyclical in the coming quarters, but we don’t see much difference between the two ETFs’ dividend profiles if all factors are considered.
Expenses
Both ETFs have expense ratios of 0.04%, so the difference is negligible. IGSB does have a higher bid-ask spread, as its bid-ask spread of 0.03% exceeds IGIB’s by 10 basis points. This is likely due to the lower liquidity available in the short-term bond market.
Although IGSB has a higher bid-ask spread than IGIB, we think the difference is too small to rank IGIB superior in terms of expenses.
Risks to The Analysis
Our analysis looked at the bond market’s various risk premiums under the assumption that an interest rate pivot is more likely than a higher-for-longer interest rate environment. As such, we highlight forecasting risk.
Furthermore, investors must consider that fixed-income vehicles such as IGSB and IGIB have different tax consequences for different types of investors. Thus, additional consideration must be given to both assets’ tax liabilities.
Lastly, IGSB has a lower historical total return level than the broader U.S. bond market, while IGIB has a higher value at risk. Thus suggesting that both assets have risk-adjusted idiosyncrasies that might be unfavorable to some.
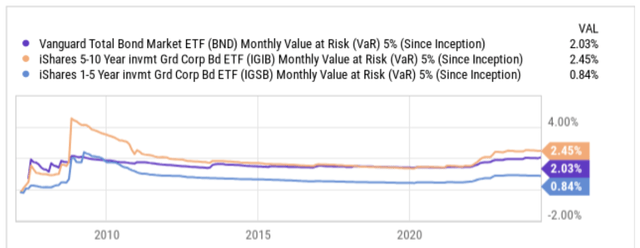
Value-at-Risk (Seeking Alpha; YCharts)
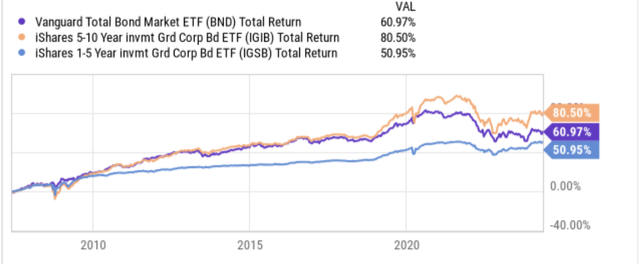
Seeking Alpha; YCharts
Final Word
Our analysis used numerous fundamental variables to compare the iShares 5-10 Year Investment Grade Corporate Bond ETF and the iShares 1-5 Year Investment Grade Corporate Bond ETF.
We believe the iShares 1-5 Year Investment Grade Corporate Bond ETF is a better buy as its lower duration phases out the uncertainty baked into the current interest rate environment. Moreover, we think the ETF has better credit quality dispersion.
Although we don’t consider iShares 5-10 Year Investment Grade Corporate Bond ETF a sell, we think the iShares 1-5 Year Investment Grade Corporate Bond ETF is a winner in today’s market environment.
Credit: Source link