

Hill Street Studios/DigitalVision via Getty Images
ONEY strategy
SPDR Russell 1000 Yield Focus ETF (NYSEARCA:ONEY) started investing operations on 12/02/2015 and tracks the Russell 1000 Yield Focused Factor Index. It has 300 holdings, a 30-day SEC yield of 3.32% and an expense ratio of 0.20%. Distributions are paid quarterly.
As described by FTSE Russell, the underlying index selects and weights constituents from the Russell 1000 Index by combining three common factors (Quality, Value and Size) and a focus factor (Yield).
- The Quality factor is based on profitability, efficiency, earnings quality and leverage.
- The Value factor is based on cash flow yield, earnings yield and sales yield.
- The Size factor is based on the full market capitalization (smaller is better).
- The Yield factor is based on the trailing 12-month dividend yield.
Factors are calculated and normalized separately after removing outliers, then combined together along with market cap for the weight calculation. Finally, rules are applied to cap weights of constituents and industries depending on their weights in the parent index. The index is rebalanced annually in June, and the turnover rate in the most recent fiscal year was 33%. This article will use as a benchmark the parent index Russell 1000, represented by iShares Russell 1000 ETF (IWB).
ONEY portfolio
The portfolio is almost exclusively invested in US companies (98% of asset value), with a focus on mid-cap companies (about 65%). Large and mega-caps weigh less than 12% of assets.
The heaviest sector is financials (17.8%), followed by industrials (14.3%), consumer discretionary (13.5%) and energy (13%). Other sectors are below 10%. Compared to IWB, ONEY massively underweights information technology, healthcare and communication services. It overweights all other sectors, mostly energy, real estate, utilities and materials.
Sector breakdown (chart: author; data: SSGA, iShares)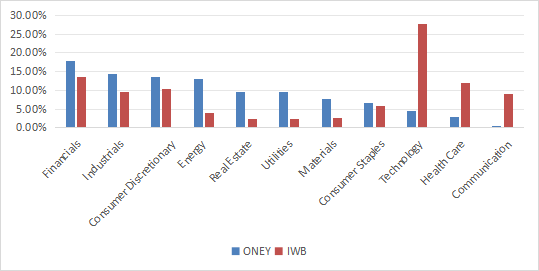
The top 10 holdings, listed in the next table with fundamental ratios, have an aggregate weight of 13.7%. The heaviest position is below 2%, so risks related to individual companies are low.
|
Ticker |
Name |
Weight% |
EPS growth %ttm |
P/E ttm |
P/E fwd |
Yield% |
|
XOM |
Exxon Mobil Corp. |
1.80 |
-44.87 |
14.23 |
12.39 |
3.28 |
|
FANG |
Diamondback Energy, Inc. |
1.60 |
-26.57 |
11.36 |
10.56 |
4.66 |
|
DVN |
Devon Energy Corp. |
1.49 |
-42.70 |
9.63 |
9.57 |
4.14 |
|
DOW |
Dow, Inc. |
1.47 |
-58.10 |
34.02 |
19.03 |
4.91 |
|
VLO |
Valero Energy Corp. |
1.41 |
-42.59 |
7.76 |
8.99 |
2.73 |
|
PCAR |
PACCAR, Inc. |
1.25 |
60.40 |
10.88 |
12.70 |
4.20 |
|
CAH |
Cardinal Health, Inc. |
1.23 |
29.38 |
43.84 |
13.50 |
2.02 |
|
LYB |
LyondellBasell Industries N.V. |
1.18 |
-29.91 |
15.33 |
11.94 |
5.04 |
|
MMM |
3M Co. |
1.18 |
-231.86 |
N/A |
12.90 |
6.22 |
|
PSX |
Phillips 66 |
1.14 |
-49.78 |
11.06 |
11.26 |
3.20 |
Ratios from Portfolio123
Fundamentals
ONEY is much cheaper than the Russell 1000 regarding valuation ratios, as reported in the next table. Growth metrics are mixed: earnings growth is on par with the benchmark, sales growth is slightly below it, whereas cash flow growth is significantly inferior.
|
ONEY |
IWB |
|
|
Price/Earnings TTM |
13.98 |
23.91 |
|
Price/Book |
1.88 |
4.08 |
|
Price/Sales |
0.95 |
2.65 |
|
Price/Cash Flow |
7.89 |
16.45 |
|
Earnings Growth |
21.51% |
21.43% |
|
Sales Growth |
6.20% |
8.63% |
|
Cash Flow Growth |
2.05% |
8.50% |
Source: Fidelity
In my ETF reviews, risky stocks are companies with at least 2 red flags among: bad Piotroski score, negative ROA, unsustainable payout ratio, bad or dubious Altman Z-score, excluding financials and real estate where these metrics are unreliable. With this assumption, risky stocks weigh about 10% of asset value. According to my calculation of aggregate quality metrics (reported in the next table), portfolio quality is marginally better than the benchmark.
|
IWB |
ONEY |
|
|
Atman Z-score |
3.76 |
2.59 |
|
Piotroski F-score |
5.94 |
5.39 |
|
ROA % TTM |
6.04 |
5.61 |
Performance
ONEY has underperformed the Russell 1000 by 2.9% in annualized return since 1/1/2016. Moreover, the risk measured in drawdown and standard deviation of monthly returns (“volatility” in the next table) is significantly higher than for the benchmark.
|
Total Return |
Annual Return |
Drawdown |
Sharpe ratio |
Volatility |
|
|
ONEY |
132.79% |
10.66% |
-46.80% |
0.54 |
20.35% |
|
IWB |
188.48% |
13.54% |
-34.60% |
0.78 |
16.18% |
Data calculated with Portfolio123
ONEY has lagged IWB by 9% over the last 12 months:
ONEY vs Russell 1000, trailing 12 months (Seeking Alpha)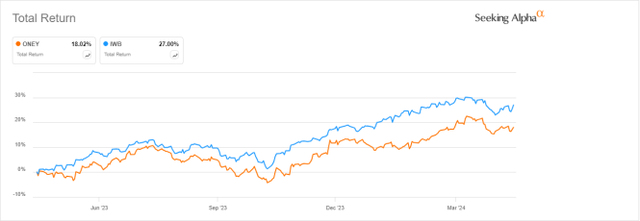
The annual sum of distributions has increased from $2.30 per share in 2018 to $3.16 in 2023. It is a 37.4% growth in 5 years, beating the cumulative inflation (about 22%, based on the Consumer Price Index).
ONEY distribution history (Seeking Alpha)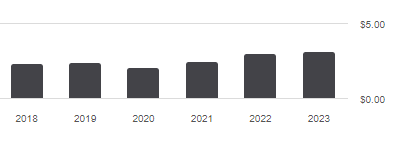
Competitors
The fund’s strategy is focused on dividend and includes value and quality criteria. The next table compares characteristics of ONEY and five popular multi-factor dividend ETFs (mostly dividend growth funds):
- Vanguard Dividend Appreciation ETF (VIG)
- iShares Core Dividend Growth ETF (DGRO)
- WisdomTree U.S. Quality Dividend Growth Fund (DGRW)
- ProShares S&P 500 Dividend Aristocrats ETF (NOBL)
- First Trust Rising Dividend Achievers ETF (RDVY)
|
ONEY |
VIG |
DGRO |
DGRW |
NOBL |
RDVY |
|
|
Inception |
12/2/2015 |
4/21/2006 |
6/10/2014 |
5/22/2013 |
10/9/2013 |
1/6/2014 |
|
Expense Ratio |
0.20% |
0.06% |
0.08% |
0.28% |
0.35% |
0.49% |
|
AUM |
$789.41M |
$93.72B |
$26.82B |
$12.51B |
$11.84B |
$10.29B |
|
Avg Daily Volume |
$2.07M |
$150.50M |
$86.18M |
$44.11M |
$45.07M |
$42.02M |
|
Holdings |
300 |
343 |
423 |
299 |
69 |
52 |
|
Assets in Top 10 |
13.70% |
28.88% |
26.47% |
37.00% |
15.66% |
21.78% |
|
Turnover |
33.00% |
13.00% |
30.00% |
28.00% |
22.00% |
57.00% |
|
Yield TTM |
3.07% |
1.82% |
2.35% |
1.69% |
2.08% |
2.02% |
|
Div Growth 5 Yr CAGR |
6.71% |
8.46% |
9.70% |
4.87% |
7.15% |
19.31% |
ONEY is the smallest (in assets) and less liquid (in dollar volume) of this group, by far. It has the highest yield, but the second lowest 5-year dividend growth rate. The next chart compares total returns, starting on 12/7/2015 to match all inception dates. ONEY is the second worst performer and had the deepest drawdown in 2020, while RDVY and DGRW are leading.
ONEY vs competitors since 12/7/2015 (Seeking Alpha)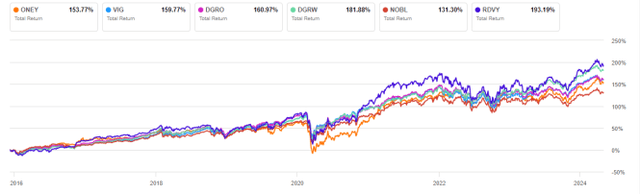
Nonetheless, ONEY is in the middle of the pack over the last 12 months.
ONEY vs competitors, 12-month return (Seeking Alpha)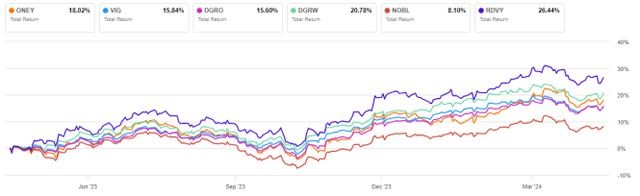
Takeaway
SPDR Russell 1000 Yield Focus ETF has a portfolio of 300 dividend stocks with quality and value characteristics. ONEY portfolio is well-diversified across sectors and holdings. The fund’s valuation is attractive, but quality looks average despite the strategy description, and performance is unconvincing. ONEY has lagged its parent index and competitors since inception, while showing a high volatility.
Credit: Source link