

tadamichi
Are you a risk-conscious investor, looking to diversify your dividend-oriented portfolio?
The odds are you are already familiar with Schwab U.S. Dividend Equity ETF (NYSEARCA:SCHD).
With its transparent selection process and risk-conscious approach, tracking the total return of the Dow Jones U.S. Dividend 100 Index, this ETF has become the gold standard for dividend portfolios.
Instead of chasing high-flyers, this passively managed ETF focuses on dividend-paying firms with healthy balance sheets, generally better insulated from the volatility of the market, taking a more defensive stance.
If you had invested $10,000 in SCHD back in 2012 and reinvested all the dividends, you would be sitting today on $42,963 or 12.55% CAGR, compared to 13.97% CAGR of SPDR® S&P 500 ETF Trust (SPY) and eye-popping 18.96% CAGR of Invesco QQQ Trust ETF (QQQ).
In practice, you would come out with significantly less money, compared to these major cap-weighted ETFs which include the high-flying names, but you would most likely sleep better at night by investing in SCHD as the worst year pullback was only -5.56 % compared to SPY’s -18.17% and QQQ’s -32.58%.
Significantly lower volatility, a defensive approach, 3%+ dividend yield, and reasonable risk-adjusted returns are the reasons to invest in SCHD.
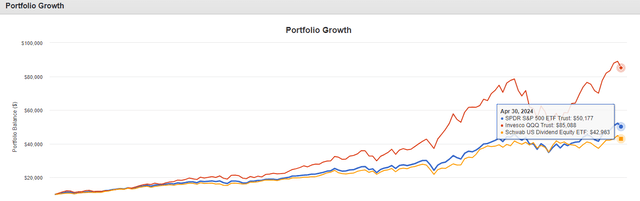
Growth of $10,000 (Portfolio Visualizer)
The low, 0.06% expense ratio, enables investors to invest in the highest quality dividend stocks at a fraction of the cost, enjoying the hands-free approach. In practice, for each $10,000 you invest in SCHD, the ETF charges you only a $6 management fee, before taxes and trading fees.
SCHD Selection Process
To pursue its strategy, SCHD invests in stocks that are included in the Dow Jones U.S. Dividend 100 Index.
The underlying index is designed to measure the performance of high dividend-yielding stocks with a consistent dividend-paying record and fundamental strength over its peers measured through selected financial ratios.
The 100-component index does not include many favorites of Seeking Alpha income investors, such as BDCs, REITs, or MLPs.
The four key criteria for selection are:
- At least 10 consecutive years of dividend payments
- Minimum market capitalization of $500 million
- Minimum liquidity criteria
As the ETF’s core focus lies in dividend income, once a company passes the initial selection process, the components are then rated based on four fundamental metrics:
- Cash flow to total debt
- Return on equity or “ROE”
- Dividend yield
- 5Y dividend growth rate
Instead of being purely market cap weighted, as many other popular passive ETFs, SCHD components are weighted based on a modified market capitalization approach, where no single component can represent more than 4% of the index, and sectors are capped at a maximum of 25% of the index.
Limiting the sector’s weight in the index enables better diversification, especially during today’s periods where technology stocks dominate the returns and disproportionately dominate indices, increasing risks for investors.
The index and ETF composition alike are reviewed on an annual basis, with rebalancing on a quarterly.
SCHD Holdings & Dividend Focus
With 103 holdings in the portfolio, the ETF is well-diversified across many quality businesses, and instead of being tech-heavy as other market cap-weighted indices, Financials and Health Care are the two dominant sectors.
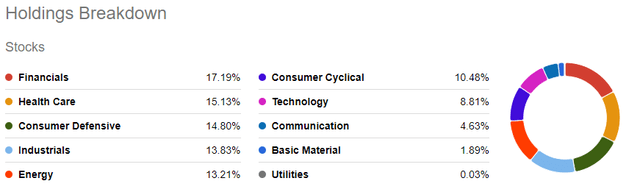
Sector Exposure (Seeking Alpha)
In fact, there are only 3 technology stocks at the moment, Texas Instruments, Cisco Systems, and Skyworks Solutions (SWKS), perhaps too light exposure for my liking, but in reality better for defensive investors given the lower cyclicality.
The low technology exposure is also one of the reasons behind the recent underperformance of the ETF, delivering a 2.28% total return on a year-to-date basis.
The top 10 holdings of the ETF represent roughly 41% of the total weight of the index.
In case you wonder why the weight of some of the constituents is higher than the 4% cap, the reason is the outperformance of these stocks in relation to the rest and subject to rebalancing at the end of Q2.
| Symbol | Company | Weight |
| (TXN) | Texas Instruments Inc | 4.26% |
| (LMT) | Lockheed Martin Corp | 4.20% |
| (CVX) | Chevron Corp | 4.18% |
| (PEP) | PepsiCo Inc | 4.09% |
| (KO) | Coca-Cola | 4.09% |
| (PFE) | Pfizer Inc | 4.08% |
| (AMGN) | Amgen Inc | 3.99% |
| (UPS) | United Parcel Service Inc | 3.97% |
| (CSCO) | Cisco Systems Inc | 3.88% |
| (VZ) | Verizon Communications Inc | 3.86% |
The top stocks offer a well-balanced blend across various sectors.
Seeing the list of the top 10 stocks raises questions for any dividend growth investor as we are not seeing long-term core holdings such as Broadcom Inc. (AVGO) and Merck & Co., Inc. (MRK), being removed at the last re-balancing as a result of their superb performance pushing the yields below the minimum threshold.
The goal of the ETF is to deliver a reliable dividend income, hence removing growth stocks whose yields suffered as a result of great performance is understandable, however, it may raise questions on the sustainability of such a strategy over the long-term, sacrificing total returns.
In hindsight, the continuous re-balancing of the ETF is the prime reason for the attractive 3.46% dividend yield it offers.
Given the automatized selection process, and eliminating human judgment error, the ETF has managed to grow its dividend with a 100% success rate over the past 12 years.
Over the past 5-year time horizon, the average dividend growth rate has been pleasing 11.8%.
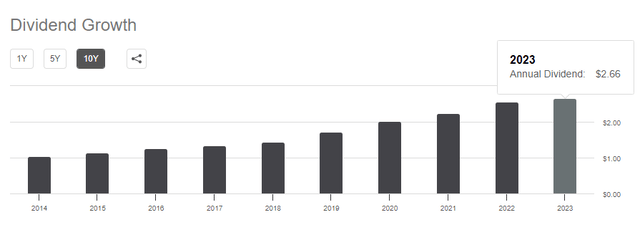
Dividend Growth (Seeking Alpha)
Going forward, I am expecting the dividend growth to slow down towards 7% to 9% on an annual basis as some of the faster-growing companies have been removed from the ETF.
Based on my own portfolio-building experience, building a close to 3.5% yielding portfolio with double-digit dividend growth over prolonged periods is rather challenging, and often prone to timing error, highlighting SCHD’s superiority in the space.
That’s one of the reasons why I generally recommend including SCHD as a core position in dividend growth and income-oriented portfolios.
Here are a few of my examples of how to incorporate SCHD into your portfolio:
What Investors Should Buy SCHD?
With total net assets of over $56 billion, SCHD is in fact 25th largest ETF traded in the US.
The sheer size of the ETF gives us a good understanding of its popularity as we can find it across many different portfolios of investors with a wide range of objectives.
In fact, only US investors are eligible to buy the ETF, as it does not have a UCITS alternative, European investors have to look elsewhere, even though a similar ETF with such wide dividend exposure and quality is hard to find.
SCHD is by design a defensive ETF, that shows resilience during market drawdowns but remains competitive during bull markets.
The selection process and maturity of its constituents are some of the reasons why the ETF better absorbs the shocks of the market and generally tends to perform reasonably well during economic slowdown and recessions, hence buying the ETF when one expects economic catastrophe, might be a sound idea.
To give you an idea of its resilience, here is a view into how each of the three mentioned ETFs performed during the 2022 market drawdown:
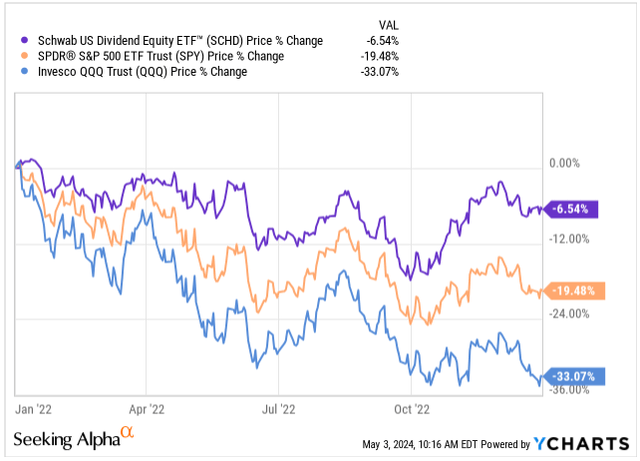
2022 ETF Performance (Seeking Alpha)
Another reason is the income. By nature, the ETF is built to satisfy the needs of retirees and income-oriented investors and with a close to a 3.5% yield, the ETF is successful in doing so.
In today’s investment landscape with elevated FED funds rates, retirees have alternatives such as treasuries, money markets, and bonds, but remember that even during the period between 2020 to 2022 when the interest rates hit a rock bottom, the ETF was still paying attractive 2.8% dividend.
One reason I personally use the ETF for outside of the income, is the diversification.
If you are an investor buying market-weighted ETFs such as the mentioned SPY and QQQ, you are at the mercy of the market’s exposure towards the tech mega-cap stocks that make up significant portions of the ETF.
Buying SCHD enables you to diversify away from the mega-cap stocks, towards the still large-cap, but more mature, less cyclical companies.
Takeaway
With all being said, recently I have seen increasingly negative commentary towards SCHD’s broken stock selection model as the ETF has been underperforming the market-weighted ETFs.
In reality, as interest rates rise, the appetite for dividend-yielding stocks decreases as other, interest rate-driven alternatives become viable once again.
But we cannot look at investment through a black-and-white lens, the economy moves in cycles and eventually, the rates will be cut, increasing the demand for ETFs with attractive dividend yields such as SCHD.
Projecting the rate cuts is a fool’s errand so I am not even going to try.
Yet, today is the moment to capitalize on more favorable valuations and buy into ETFs such as SCHD.
Remember, as all dividends are distributed, don’t expect total returns similar to SPY or QQQ as a result of the absence of long-term compounding.
Instead, use SCHD as an income vehicle, a defensive mechanism, or a diversification tool.
Credit: Source link