
Dragon Claws/iStock via Getty Images
TLT, inflation and fiscal sustainability
The iShares 20+ Year Treasury Bond ETF (NASDAQ:TLT) provides investors with exposure to Treasury bonds with extended duration. As pointed out by the TLT ETF’s description (the emphases were added by me), it “seeks to track the investment results of an index composed of U.S. Treasury bonds with remaining maturities greater than twenty years.” As a result, TLT’s effective duration is more than 16 years as seen in the chart below and its weighted average maturity is more than 25 years.
The price changes of a bond can be approximated by the product of its rates and its duration. As such, with TLT’s combination of long duration and the interest uncertainties that we’re facing, TLT investors can face tremendous price volatilities ahead, and I probably won’t recommend it for investors with a nearer investment time frame or more conservative risk profile (more on this later).
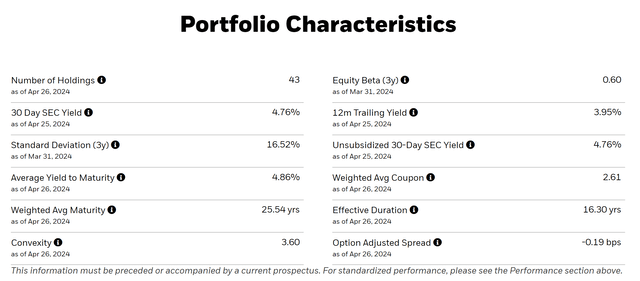
TLT fund description
However, for investors with a longer investment frame (say at least 3~5 years or longer) and are more risk tolerant, the thesis of this article is to explain why I see more upside potential than downside risks. There are a few reasons, including our inverted yield curve, the possibility of a hard landing, etc. But today I will focus on a more macroscopic factor: The balance between inflation and fiscal sustainability. I don’t believe the current long-term rates can be sustained in the long term. Ultimately, long-term rates cannot exceed the rate of real GDP growth (around 2% per annum on average) plus inflation (also around 2% on average).
In recent years, due to the US’ rapidly rising debt and interest rates at the same time, I think we’re approaching a point where fiscal sustainability needs to be seriously considered together with our inflation target before the Fed decides to raise rates again.
And next, I will analyze Japan’s debt cycle and argue why the U.S. is likely to adopt the same strategy and cap rates.
TLT and Japan’s bond cycle
Japan’s government debt has been above $9 trillion U.S. since 2020, as seen in the chart below. The figure is projected to exceed $10 trillion starting in 2023.
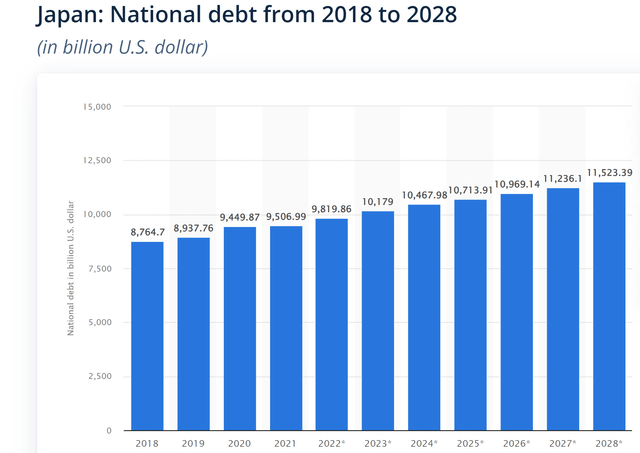
Statistica
To anchor this in terms of its GDP, the table below shows that the World Economics estimates Japan’s GDP to be $5.822 trillion for 2023 and about the same for 2024 also as seen in the chart below. As such, Japan’s public debt is currently around 175% of its GPD based on these projections.
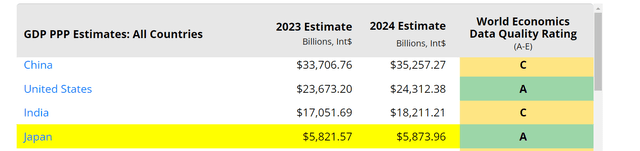
World Economics
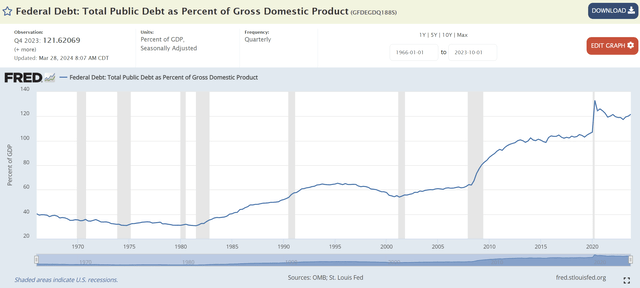
The U.S. public debt is not as high as Japan’s, but it also exceeds GDP by a considerable margin and is rising quickly. As you can see from the chart below, the total U.S. public debt is now more than 120% of GDP. The combination of rising debt and rising interest rates at the same time has caused a ballooning effect on interest expenses.
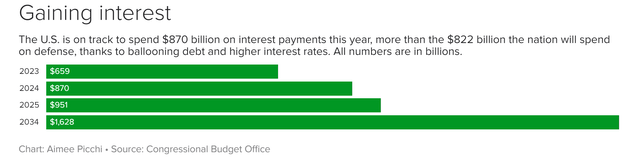
As a notable example, the following data from the Congressional Budget Office shown below points to a 32% increase in interest expense in the year 2024 alone compared to 2023. To better contextualize things, 2024’s interest expense is:
…. on track to spend $870 billion on interest payments this year, more than the $822 billion the nation will spend on defense, thanks to ballooning debt and higher interest rates. All numbers are in billions. To be sure, higher interest rates aren’t the only factor raising the cost of servicing the country’s debt. Over the last decade, the U.S. has almost doubled its outstanding debt, which surged to $33 trillion last year from $17 trillion in 2014, according to Treasury data.
Congressional Budget Office
FRED
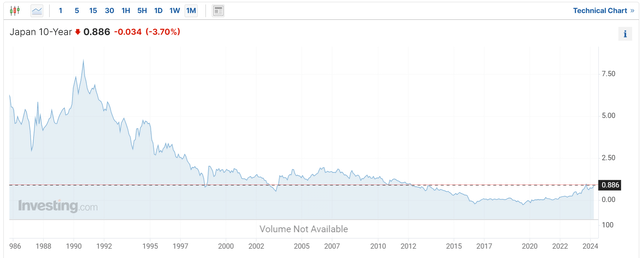
I just don’t see the situation can continue for too long from a fiscal standpoint of view. Thus, I see a good possibility for the U.S. to follow Japan’s strategy and implement some type of cap on bond rates. For example, the Bank of Japan (“BOJ”) implemented a policy called Yield Curve Control (“YCC”) in 2016. This policy aimed to stimulate the economy by keeping long-term interest rates artificially low. Specifically, the BOJ targeted the 10-year Japanese Government Bond (“JGB”) yield and pledged to buy unlimited amounts of bonds if necessary to keep the yield around a specific target, typically around 0%. This essentially capped the rates on these bonds. In October 2023, the BOJ announced a shift in this policy. They moved away from a strict cap and now aim to maintain the 10-year JGB yield as a “reference point” around 1%. This allows for some flexibility in the yield, but still signals the BOJ’s intention to influence bond rates.
All told, as you can see from the chart below, Japan’s 10-year Treasury rates dropped drastically from a peak of around 8% in the 1990s to be below 1% starting around 2013 (and even into the negative regimes for some time), creating a remarkable long bull bond market.
Source: Investing.com
Risks and final thoughts
As aforementioned, the price changes of a bond can be approximated by the product of its rates and its duration. In TLT’s case, its effective duration is about 16%, thus a 1% drop in yield can create a potential upside of ~16% (plus the coupons).
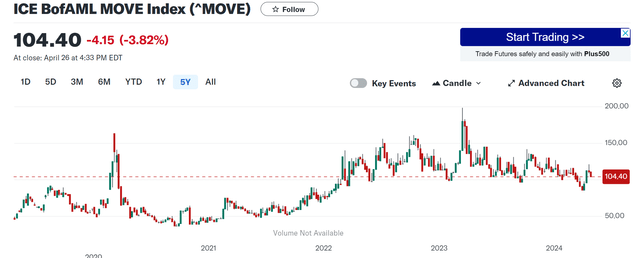
However, the downside risks are magnified as well. In particular, the following ICE BofAML MOVE Index (^MOVE) shows that bond volatility is relatively high currently. I took the data from Yahoo Finance. The MOVE index is a financial benchmark that tracks the volatility of the U.S. Treasury bond market. In simpler terms, it reflects how much investors expect bond prices to fluctuate. As seen before the COVID-19 pandemic (i.e., before 2022’s epic QE and the subsequent inflation), the MOVE index has been below 75 most of the time and spent a considerable amount of time hovering around 50 only. The index has been above 100 most of the time since 2022, reflecting the market anticipation for significant price swings in the bond market. With the extended duration of TLT, such heightened volatility could be further magnified.
Yahoo
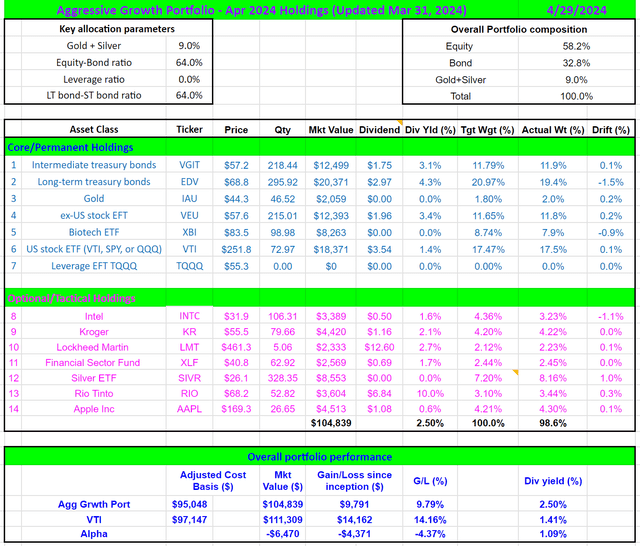
Given these considerations, I probably won’t recommend TLT for everyone. But my overall conclusion is that the upward risks outweigh the downward risks in the longer term (say 3~5 years or longer). For such investors, I think this is a good time to add TLT (or other similar funds such as VGLT of EDV) to the mix of equity funds and/or high-quality stocks. Our own portfolio follows our analysis. The chart below shows the current holdings in our real-money portfolio. As seen, it holds a substantial amount of Vanguard Extended Duration Treasury Index Fund ETF (EDV). EDV has essentially the same characteristics as TLT and the primary reason we choose EDV over TLD is its lower fee (0.06% vs. TLT’s 0.15%).
Author
Credit: Source link