

Its not a perfect analogy but its clse on many data sets. Chris Stein/DigitalVision via Getty Images
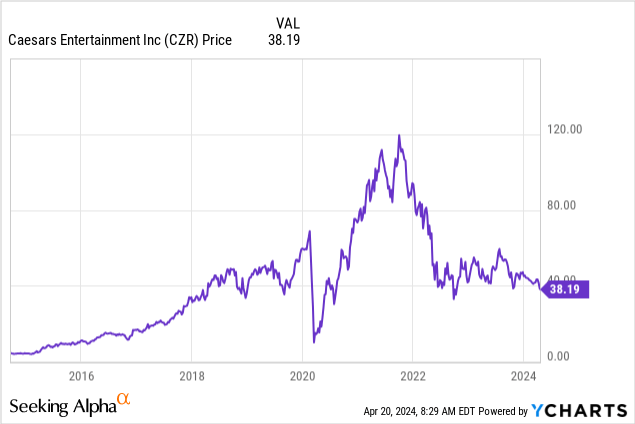
Premise: We conducted a SWOT analysis (Strengths, Weaknesses, Opportunities, Threats) with our consulting associates in an effort to value the shares of Caesars Entertainment, Inc. (NASDAQ:CZR) relative to peers. Our previous view was that CZR had fallen far below what we considered fair value. Last December, CZR traded at $48 when we posted a price target of $66 for some time later this year.
Our thesis was that on all fronts at that time, CZR revenues were deep into a post-covid recovery cycle that had lots of ramp ahead. Back in July of 2023, CZR traded at $57. What happened? By any measure, the company was doing well.
CZR revenue was deep in recovery. The hotels were jam packed, particularly the Vegas properties. REVPAR was high, gaming win ahead both in slots and table games. And the sports book was moving toward positive EBITDA. (It has indeed achieved black ink going forward). Management’s focus on addressing its huge debt overhang was strong. Along with FCF providing the cash, debt was beginning to decline.
I was joined in a bullish outlook by some analysts, who cited similar tailwinds. So what happened to CZR that we did not see coming, nor several others for that matter? Whether it was a handful or a broad consensus, our guidance didn’t matter. Mr. Market shrugged off the bullish takes.
Seeking Alpha and other top financial sites present opinions across a broad spectrum from highly bullish to bearish every day. And among the great calls, we all have our share of misses – many by contributors with otherwise fine track records. So it was time we did a basic SWOT analysis on CZR to find how their forensic business models work in a changing world.
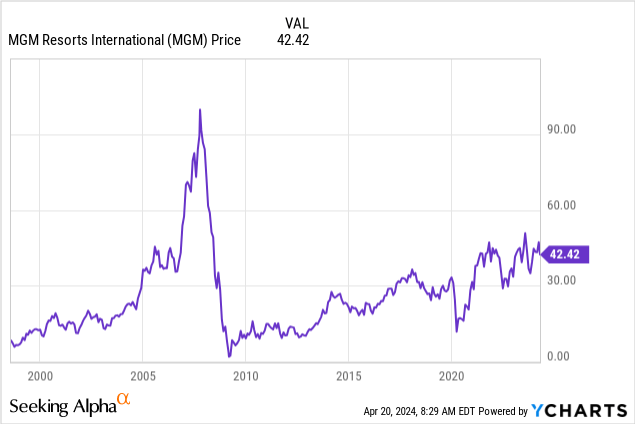
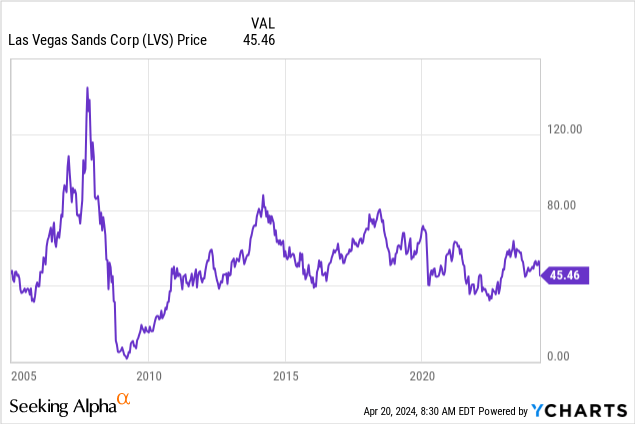
A good way to begin was to compare CZR with its two most important competitive peers: MGM Resorts (MGM) and Las Vegas Sands (LVS). And in that process, we uncovered what, we believe, is a hidden value story for all three.
Our SWOT analysis built off the Harvard MBA model produced no surprises. CZR led in database strength, (65m) property coverage, its key weakness was no Asia footprint, opportunities in flexible movement of many assets. MGM was tops in digital with its #3 position in sports betting revenue, the widest global outlook for growth, and LVS for its powerful Asia recovery. But lack of exposure to the US market after the Vegas property sales was questionable. Overall, the three operators shared far more SWOT characteristics in common than differences.
The takeaway – the three companies could be valued as a single giant, with weaknesses of one compensated with strengths from the other. The clear surprise: They could be de facto one company in the eyes of investors, with a combined forward growth arc that alone would not be as attractive.
Welcome to the Gaming Trio buy vs. Walt Disney
In working out the comparative virtues or missing pieces of CZR and its two key peers, we unearthed a far more intriguing set of facts. The similarities between the three gaming giants were amazing. So much so that a mind experiment suggested itself immediately. What if the three companies were folded into a mini-portfolio? No, we don’t presume to have found the holy grail of can’t lose, sure thing. We do think investors seeking yield in times like this have to think of other strategies.
And what if we compared the trio’s combined price with that of, say, Disney (DIS), which alone trades at the exact same price? On a pure money in returns out basis, what looks like a far better bet for the money? When you pick stocks, you mostly evaluate the odds based on performance. This approach is the equivalent of the money line bet – straightforward win or lose.
Of course, this is not an apples to apples analogy. The trio is in the business of entertaining adults. DIS is in the business of entertaining families and children – or it is supposed to be. But a large component of the business of both is the revenue reaped from visitation to its brick and mortar properties. The trio runs 104 properties in total in the Vegas strip, US regions, Macau and Singapore.
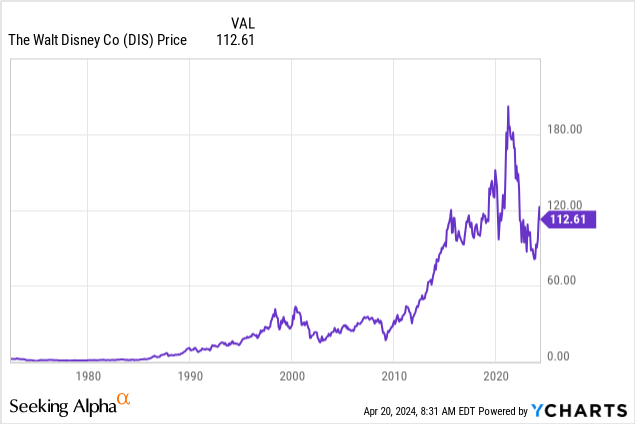
Total US/global visitors to key prime Disney parks: 72m in ’23
Total visitors (est) to US and Asian casinos: 110m in ’23.
The revenue of both is entirely generated by arrivals of total guests, both day trippers and overnight visitors. So in essence, they are both also in the business of body generation.
Clearly, where the comparison stops is in the multitude of DIS verticals in electronic entertainment and films. The disparity of annual revenues makes a difference, for sure. Yet DIS total revenue is ~$98b, total revenue of the trio is $40b, But if we isolate DIS parks alone, the revenue is $33.6b – remarkably close in terms of the live visitation only.
The trio’s debt is a combined $70b vs. DIS at $45b, but investors tend to see debt as similar evidence of financial discipline or recklessness. Its vote on management weighed relative to overall company performance.
Our mind experiment: Recognizing the differences and similarities in many data points, can you make the case that a buy-in of our trio makes better sense than one on DIS?
We probed a bit further:
When merging the selling price of the three stocks, we came to a total value of $113 at writing. We said this could be a rare case of the whole worth far more than the parts.
That posed a what if?
What if the three casino peers were one company?
CZR: $39
MGM: $42
LVS $50
Total: $113
Assume buying 200 shares total all three at the prices shown for one year’s hold.
Here’s the 2023 EPS COMPARATIVE:
DIS $1.28
THE TRIO: $8.90
In other words, the trio earned 7X what DIS did in the same year. Is this totally dispositive that your investment in, say, 200 shares of the trio vs. the same buy for DIS was far and away a smarter investment choice? Not necessarily, but our point here is this: You can bet that on sentiment alone, the vast majority of investors would probably buy the 200 of Disney than roll the dice on a trio of casino stocks. Our mind experiment simply challenges that conventional wisdom.
It is clear that both propositions are companies which have equally borne the headwinds of covid and its longer-term consequences. Both face a sword of Damocles swinging above them in a possible recession that would constitute a big time headwind to any retail operation tied to body generation. Add to that the disruption in streaming and theatrical attendance for DIS and the soaring labor and insurance costs plaguing the casino operations and, for both, the debt balances too big too long.
Conclusion
Our mind experiment raises the notion that investors can make their own little hedge funds with mini packages of stocks within similar sectors, total up the cost, and point the package cost against a similarly valued sector stock that sells for three to five times as much to a similar price.
This is not to imply that different headwinds can besiege each stock over a given duration. But making a pure money-on-money decision on highly similar stocks packaged can be an excellent alternate strategy in markets in turmoil or calm. What counts in the end are returns.
In this mind experiment, we see the trio as outperforming DIS during the same time frame in terms of EPS now and possible projections over the coming years.
Credit: Source link