

champpixs
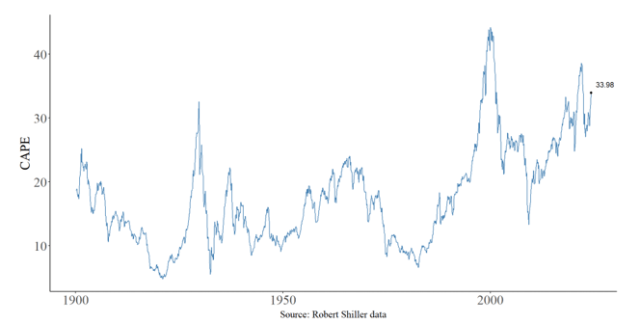
Robert Shiller’s cyclically adjusted price-to-earnings ratio (CAPE) is approaching historically high levels. In fact, CAPE’s current value has been exceeded only twice since 1900. But should you care?
Investment professionals know that despite CAPE’s historical tendency to anticipate equity market returns, it isn’t a reliable market-timing tool. The evidence discussed here offers a possible explanation for why.
As shown in Figure 1, CAPE was trendless for most of its post-1900 history, with run-ups typically followed by “compression.” For most of its history, it would have been natural to think that periods of high CAPE will be followed by periods of low CAPE.
Figure 1: CAPE, 1900-2024
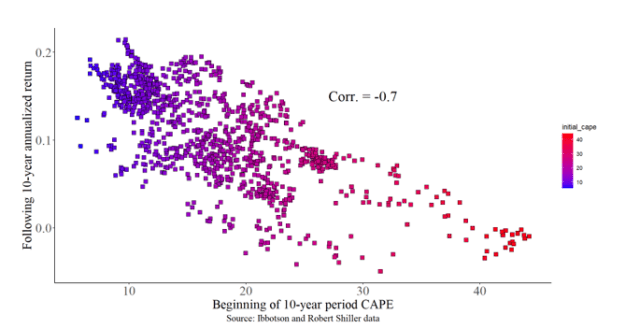
And there’s a familiar if unnerving empirical regularity linking CAPE and future equity market returns. Figure 2 plots annualized 10-year returns for the Ibbotson Large Cap stock index®. Points are filled by CAPE starting value (red = high, blue = low). As is clear from the downward-sloping pattern, CAPE values are strongly negatively correlated with future returns (correlation coefficient = -0.7). Longer term, the relationship is weaker but still negative. The correlation between initial CAPE and subsequent 20-year annualized returns is -0.3.
Combined, Figures 1 and 2 suggest that episodes of expanding CAPE are followed by episodes of contracting CAPE and subdued equity market returns.
Figure 2: CAPE (horizontal axis) and next 10-year’s annualized return, 1926-2024.
Could This Time be Different?
The question is whether the current period of expanding CAPE will be followed by a period of contraction and low equity market returns may depend on CAPE’s stability in a time series sense. My own work suggests that CAPE isn’t “stationary” and therefore shouldn’t be expected to mean revert. See “A Time-Series Analysis and Forecast of Cape” in the Journal of Portfolio Management. I revisit that question in this blog.
Testing for a CAPE Break
Since the growth rate of P (price) divided by E (earnings) is just the difference between the growth rates of P and E, the idea that CAPE might rise without bound may make investment professionals uncomfortable.
To avoid this discomfort, it is helpful to think of CAPE as a single quantity and consider how that quantity has behaved over time and whether the process that animates it has changed. That is the approach I take here.
It’s obvious from casual visual inspection of Figure 1 that CAPE changed at least once in its long history. CAPE has been elevated since the 1990s. Prior to 1990, CAPE’s mean value was 14.1. Since then, it has averaged 26.6. At 34, today’s CAPE is in 95th percentile of observations since 1900.
A critical issue for practitioners is therefore: Did CAPE “change” in the 1990s, making its behavior prior to then less relevant than since? A statistical test of a change in a time-series over a range of dates, the
Quandt Likelihood Ratio (QLR) test, can help answer this question.
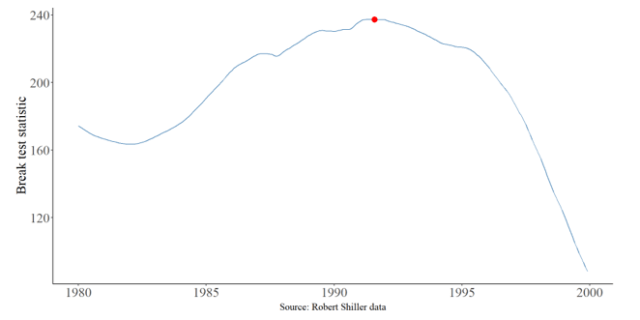
To estimate a break date using this test requires regressing CAPE on time and possible but unknown break dates (months, in this case) that fall within a particular window of time. I chose the window 1980-1999.
By including a candidate break-date interval as dummy right-hand side variables in the regression model along with their interaction with time, a simple test of joint significance on a series of regressions (one for each date) can help identify changes in a time-series process. (R code for this test and other results cited in this blog can be found here.)
Figure 3 shows the test statistics (technically, F-statistics) that result. The highest test-statistic value is the best candidate for a break in CAPE. That date, marked with a red dot in Figure 3, is August 1991. It coincides nicely with the date eyeballed from visual inspection of Figure 2.
Figure 3: Test for date break in CAPE, 1980 to 1999.
With a candidate break date in mind, we can then test whether CAPE’s behavior changed after that point. Specifically, we want to know if CAPE’s tendency to mean revert was more pronounced before 1991. To test this, I used a definition of mean reversion common in empirical finance: existence of negative serial correlation.
One serial correlation test is straightforward. Changes in CAPE over one period are regressed on the change in an immediately prior period of equal length. If the estimated coefficient is negative and significant, CAPE may be mean reverting.
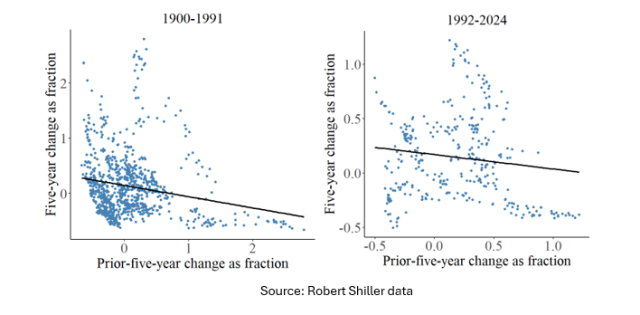
To estimate CAPE’s serial correlation, I regressed the five-year change in CAPE on its prior five-year change. Results confirm a change in CAPE’s behavior after 1991. Prior to 1991, the estimated relationship between CAPE’s change in successive five-year periods is indeed negative (coefficient = -0.19) and significant (t = 5.8). After the estimated break year (1991), however, the estimated coefficient increases to a far less meaningful -0.06, and is insignificant (t = 1.4). Notably, results for tests over longer periods are less compelling, but also less reliable.
The potential change in serial correlation is suggested by the scatterplots in Figure 4. The relationship in the right panel, which shows the more recent period, is weaker than in the earlier period, which is shown in the left panel. This is underscored by the slopes – flatter in the later period – of the linear regression fit lines drawn through each set of points.
Figure 4: CAPE 5-year change serial correlation, 1900-91 (left panel) and 1992-2024 (right panel)
Implications
Most practitioners probably feel that CAPE changed in the 1990s. It has been above its 1900 to 1989 mean value of 14.1 a remarkable 99.8% of the time since the start of that decade. That elevated CAPE is associated empirically with lower returns is unsettling. But empirical regularities may not be reliable for forecasting if underlying relationships are unstable.
My simple analysis offers evidence that CAPE changed in the 1990s and that and mean-reversion concerns may be misplaced. If CAPE changed three decades ago, however, there is nothing to prevent it from doing so again.
Should you worry that CAPE is high? That depends on whether you think CAPE will change again.
Disclaimer: Please note that the content of this site should not be construed as investment advice, nor do the opinions expressed necessarily reflect the views of CFA Institute.
Original Post
Editor’s Note: The summary bullets for this article were chosen by Seeking Alpha editors.
Credit: Source link