
• bitcoinBitcoin(BTC)$76,203.000.69%
  • ethereumEthereum(ETH)$2,415.190.75%
  • tetherTether(USDT)$1.00-0.01%
  • binancecoinBNB(BNB)$723.881.51%
  • rippleXRP(XRP)$1.290.42%
  • usd-coinUSDC(USDC)$1.000.00%
  • solanaSolana(SOL)$98.561.67%
  • tronTRON(TRX)$0.3357521.05%
  • Figure HelocFigure Heloc(FIGR_HELOC)$1.032.41%
  • zcashZcash(ZEC)$1,347.0220.36%
  • HyperliquidHyperliquid(HYPE)$78.121.17%
  • dogecoinDogecoin(DOGE)$0.0805670.75%
  • USDSUSDS(USDS)$1.000.01%
  • moneroMonero(XMR)$500.96-1.46%
  • whitebitWhiteBIT Coin(WBT)$78.230.56%
  • RainRain(RAIN)$0.012881-8.39%
  • chainlinkChainlink(LINK)$10.990.94%
  • leo-tokenLEO Token(LEO)$8.931.14%
  • cardanoCardano(ADA)$0.1951380.37%
  • stellarStellar(XLM)$0.1843714.74%
  • Ethena USDeEthena USDe(USDE)$1.000.02%
  • daiDai(DAI)$1.000.01%
  • bitcoin-cashBitcoin Cash(BCH)$220.211.31%
  • USD1USD1(USD1)$1.00-0.01%
  • uniswapUniswap(UNI)$6.695.18%
  • litecoinLitecoin(LTC)$51.791.28%
  • CantonCanton(CC)$0.0987888.76%
  • the-open-networkGram (prev. Toncoin)(GRAM)$1.31-0.10%
  • nearNEAR Protocol(NEAR)$2.6613.63%
  • avalanche-2Avalanche(AVAX)$7.493.49%
  • Global DollarGlobal Dollar(USDG)$1.000.01%
  • hedera-hashgraphHedera(HBAR)$0.073540-0.79%
  • shiba-inuShiba Inu(SHIB)$0.0000050.95%
  • suiSui(SUI)$0.713.68%
  • paypal-usdPayPal USD(PYUSD)$1.000.01%
  • crypto-com-chainCronos(CRO)$0.0564341.96%
  • tether-goldTether Gold(XAUT)$4,303.100.44%
  • BlackRock USD Institutional Digital Liquidity FundBlackRock USD Institutional Digital Liquidity Fund(BUIDL)$1.000.00%
  • Circle USYCCircle USYC(USYC)$1.140.01%
  • BittensorBittensor(TAO)$224.853.75%
  • MemeCoreMemeCore(M)$1.12-2.45%
  • Ripple USDRipple USD(RLUSD)$1.000.00%
  • okbOKB(OKB)$109.89-1.52%
  • Ondo US Dollar YieldOndo US Dollar Yield(USDY)$1.14-0.14%
  • BitwayBitway(BTW)$0.735.82%
  • AsterAster(ASTER)$0.714.26%
  • World Liberty FinancialWorld Liberty Financial(WLFI)$0.0593034.15%
  • pax-goldPAX Gold(PAXG)$4,302.330.35%
  • aaveAave(AAVE)$119.91-1.55%
  • mantleMantle(MNT)$0.551.52%
TradePoint.io
  • Main
  • AI & Technology
  • Stock Charts
  • Market & News
  • Business
  • Finance Tips
  • Trade Tube
  • Blog
  • Shop
No Result
View All Result
TradePoint.io
No Result
View All Result

VVR And PHD: Monthly Floating Rate CEFs

April 17, 2024
in Market & News
Reading Time: 5 mins read
A A
VVR And PHD: Monthly Floating Rate CEFs
ShareShareShareShareShare

Henrik Sorensen

YOU MAY ALSO LIKE

USS Lincoln sailors speak out after 9-month deployment

Putin orders 72-hour ceasefire in Kyiv

It looks like interest rates may be higher for longer than previously reckoned. If so, that should be a boon to floating rate income vehicles, such as Pioneer Floating Rate Fund (PHD) and Invesco Senior Income Trust (NYSE:VVR).

Fund Profiles:

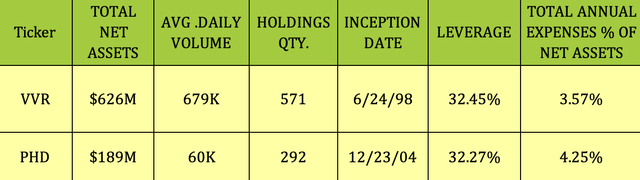
Both funds are closed-end funds. VVR began in 1998 and PHD started in 2004.

VVR seeks to provide a high level of current income consistent with preservation of capital. VVR invests mainly in floating or variable senior loans. VVR is much larger than PHD with over 10X the average daily volume and over 3X PHD’s asset base. VVR had 571 holdings as of 12/31/23 vs. 292 for PHD.

Both funds use ~32% leverage and PHD has a higher expense ratio of 4.25% vs. 3.57% for VVR. Both funds pay monthly distributions.

pfl

Hidden Dividend Stocks Plus

Dividends:

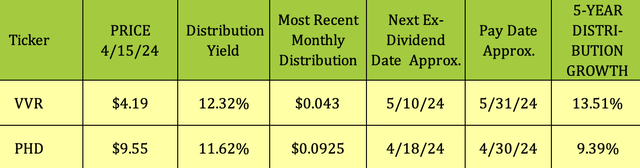
VVR has a much higher five-year distribution growth average of 13.5% vs. 9.4% for PHD. VVR had its biggest distribution growth years in 2021 and 2022, after maintaining its payouts in COVID-challenged 2020.

PHD cut its payouts by 7.8% in 2020 and has had annual growth ever since, with 2022 and 2023 seeing its biggest distribution increases.

At $4.19, VVR yields 12.32%, whereas PHD yields 11.62%. VVR should go ex-dividend next on ~5/10/24, and PHD should go ex-dividend this week, on 4/18/24.

DIV

Hidden Dividend Stocks Plus

Holdings:

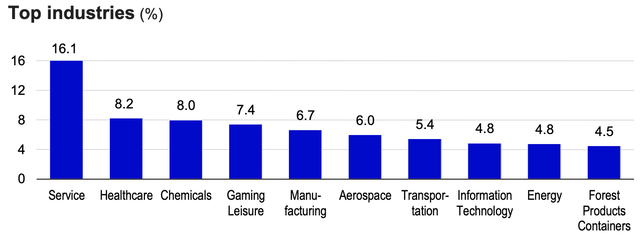
VVR’s sector exposures were stable since autumn 2023 – its top sector remains Service, at 16.1%, followed by Healthcare, Chemicals, Gaming/Leisure, and Manufacturing.

sctr

VVR site

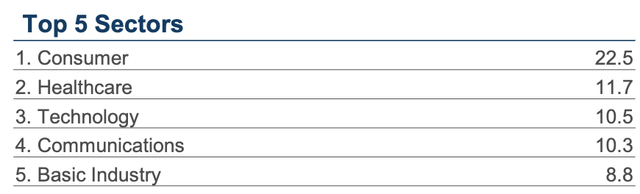
PHD’s sector exposure saw more changes in the past half year. Consumers increased from 19% to 22.5%, and Capital Goods fell off of the top 5 sectors, being replaced by Basic Industry.

sctr

PHD site

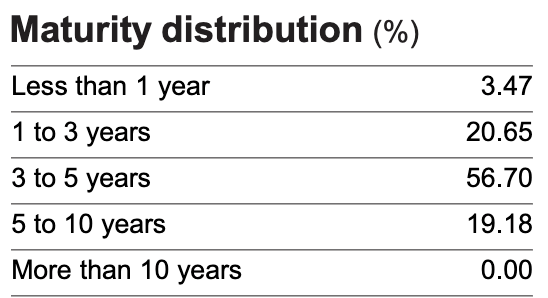
VVR’s biggest maturity exposure is 3-5 years, at 56.7% followed by 1-3 years, at 20.65% and 5-10 years, at 19.18%.

mat

VVR site

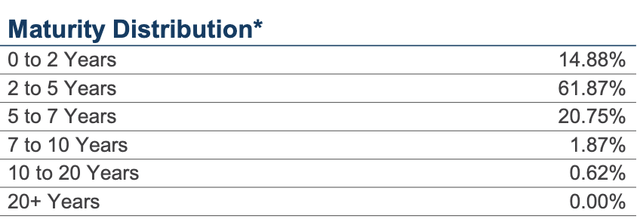
PHD’s maturities are somewhat shorter than VVR’s, with ~15% maturing in under two years.

MAT

PHD site

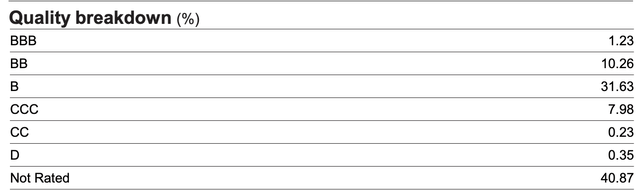
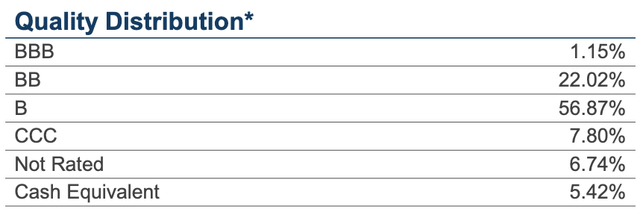
Both firms favor B-rated securities, although VVR has a much lower exposure to them, at 31.6%, vs. 56.87% for PHD. The biggest difference in quality between the two funds is that VVR holds 40.87% in unrated securities, vs. just 6.74% for PHD.

rtg

VVR site

PHD has a larger exposure to BB-rated issues, at 22%, vs. 10.26% for VVR.

rtg

PHD site

Performance:

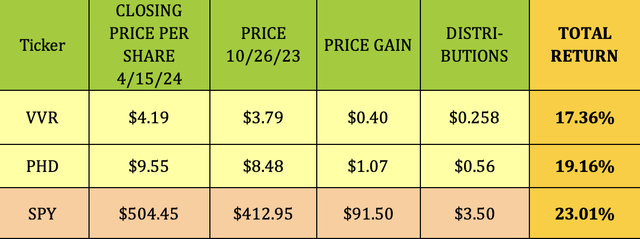
PHD has outperformed VVR on a total return basis since our previous article on these two funds, ringing up a 19.16% total return, vs. 17.36% for VVR. Both funds trailed the S&P 500 on a price performance basis.

rtn

Hidden Dividend Stocks Plus

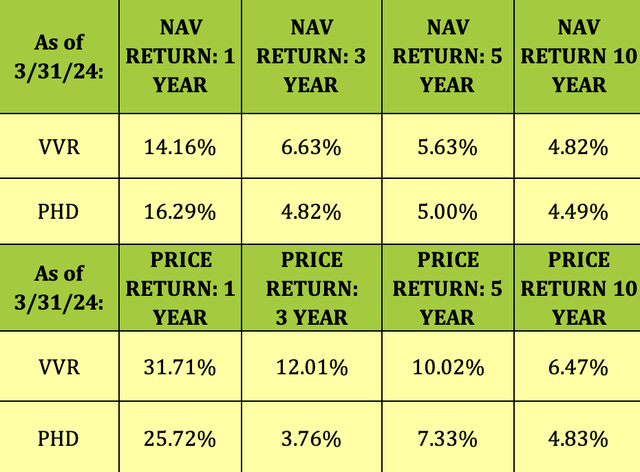
Looking back further, PHD outperformed VVR on an NAV basis over the past year, but VVR has performed better during the past 3, 5, and 10 years, in addition to outperforming PHD on a price basis over the past 1, 3, 5, and 10-year periods:

LT

Hidden Dividend Stocks Plus

Valuations:

Since NAV/Share is calculated at the end of each trading day, you have to look at the most recent closing values to determine the current NAV discount or premium. Buying CEFs at a deeper discount than their historical average discounts/premiums can be a useful strategy due to mean reversion.

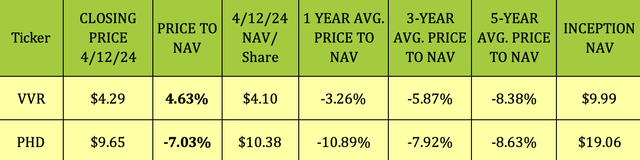
At its 4/12/24 closing price of $4.29, VVR was selling at a 4.63% premium to its NAV/share, which is much higher than its 1-, 3-, and 5-year average prices to NAV of -3.26%, -5.87%, and -8.38%.

PHD’s 7.03% discount to NAV was more in line with its 1-, 3-, and 5-year average prices to NAV of -10.89%, -7.92%, and -8.63%, although it wasn’t as deep of a discount as those historical averages.

nav

Hidden Dividend Stocks Plus

Parting Thoughts:

VVR’s price to NAV is well above historical averages – we’ll wait for a price that’s more in line with past discounts.

PHD looks closer to a buying prospect based upon its NAV discount, but it’s not quite there yet, so we advise waiting for a deeper discount. Another issue to be aware of is that the rate debate could shift rapidly over the coming months, which would impact floating rate vehicles such as VVR and PDH.

All tables furnished by Hidden Dividend Stocks Plus, unless otherwise noted.

Credit: Source link

ShareTweetSendSharePin

Related Posts

USS Lincoln sailors speak out after 9-month deployment
Market & News

USS Lincoln sailors speak out after 9-month deployment

September 17, 2026
Putin orders 72-hour ceasefire in Kyiv
Market & News

Putin orders 72-hour ceasefire in Kyiv

September 17, 2026
TransCode Therapeutics, Inc. (RNAZ) Discusses Advancing Multi-Platform Oncology Pipeline Targeting Metastatic Cancer Transcript
Market & News

TransCode Therapeutics, Inc. (RNAZ) Discusses Advancing Multi-Platform Oncology Pipeline Targeting Metastatic Cancer Transcript

September 17, 2026
Teen celebrates finishing cancer treatment with surprise from friends
Market & News

Teen celebrates finishing cancer treatment with surprise from friends

September 17, 2026
Next Post
TikTok users susceptible to having data collected by Chinese government, says Democratic lawmaker

TikTok users susceptible to having data collected by Chinese government, says Democratic lawmaker

Leave a Reply Cancel reply

Your email address will not be published. Required fields are marked *

Search

No Result
View All Result
White House may impose ‘limited safeguards’ on AI to prevent apocalypse, mass extinction: source

White House may impose ‘limited safeguards’ on AI to prevent apocalypse, mass extinction: source

September 14, 2026
2028 Volvo XC40 First Look: Hello new tech, goodbye EV

2028 Volvo XC40 First Look: Hello new tech, goodbye EV

September 10, 2026
In-N-Out managers make six figure salaries, company reveals

In-N-Out managers make six figure salaries, company reveals

September 15, 2026

About

Learn more

Our Services

Legal

Privacy Policy

Terms of Use

Bloggers

Learn more

Article Links

Contact

Advertise

Ask us anything

©2020- TradePoint.io - All rights reserved!

Tradepoint.io, being just a publishing and technology platform, is not a registered broker-dealer or investment adviser. So we do not provide investment advice. Rather, brokerage services are provided to clients of Tradepoint.io by independent SEC-registered broker-dealers and members of FINRA/SIPC. Every form of investing carries some risk and past performance is not a guarantee of future results. “Tradepoint.io“, “Instant Investing” and “My Trading Tools” are registered trademarks of Apperbuild, LLC.

This website is operated by Apperbuild, LLC. We have no link to any brokerage firm and we do not provide investment advice. Every information and resource we provide is solely for the education of our readers. © 2020 Apperbuild, LLC. All rights reserved.

No Result
View All Result
  • Main
  • AI & Technology
  • Stock Charts
  • Market & News
  • Business
  • Finance Tips
  • Trade Tube
  • Blog
  • Shop

© 2023 - TradePoint.io - All Rights Reserved!