
Pgiam/iStock via Getty Images
Welcome to another installment of our Preferreds Market Weekly Review, where we discuss preferred stock and baby bond market activity from both the bottom-up, highlighting individual news and events, as well as top-down, providing an overview of the broader market. We also try to add some historical context as well as relevant themes that look to be driving markets or that investors ought to be mindful of. This update covers the period through the first week of April.
Be sure to check out our other weekly updates covering the business development company (“BDC”) as well as the closed-end fund (“CEF”) markets for perspectives across the broader income space.
Market Action
Preferreds were flat on the week, outperforming most other income sectors due to a further tightening in credit spreads. Year-to-date, all preferreds sub-sectors are up. Banks preferreds have so far not batted an eyelid in the presence of residual worries about CRE sector exposure.
Systematic Income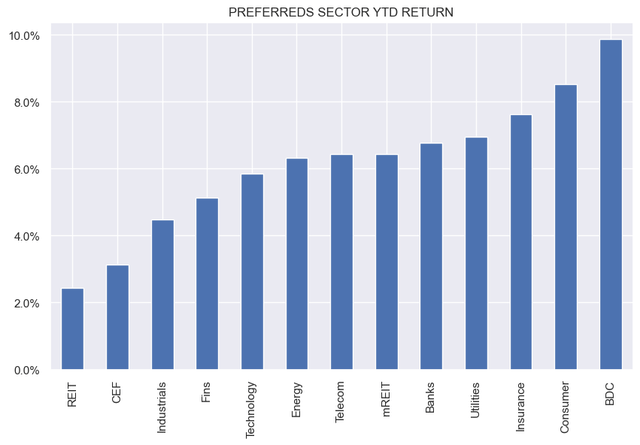
March was the fifth positive monthly total return though, as the chart clearly shows, the pace of returns has fallen consistently. Very tight spreads leave less room for capital gains going forward.
Systematic Income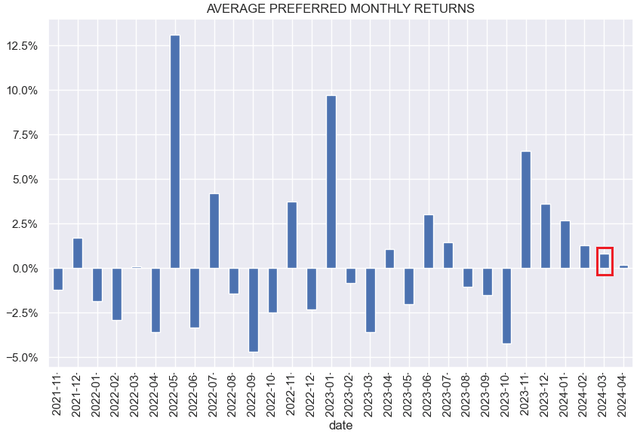
Market Themes
There is a common view that a step up in yields, particularly of Fix/Float stocks, is what’s driving redemptions across the sector. When we say a step-up in yields, what we mean is the following example. The First Horizon Series D (FHN.PR.D) is a preferred with a first call date on 1-May-24 and has a fixed coupon of 6.1% until then. As it happens, this stock will be redeemed on the first call date. However, if it were not redeemed, its coupon would switch to 3-month term SOFR + 4.12% or about 9.4% as of that date, a 3.3% increase or an over 50% step-up in coupon.
In our view, this is not the best way to gauge redemption probability because a step-up in coupons does not tell us whether a company can refinance a given preferred at a better rate. Calling a preferred just to reissue at a similar rate is just a waste of money (due to issuance fees) and work. And few companies have spare cash lying around to simply pay out a preferred without refinancing it.
The reason a step-up in coupons is not a reason to redeem a preferred is largely because the yield curve is unusually inverted. In other words, short-term rates are unusually elevated relative to longer-term rates, as shown in the chart below. However, this is simply because the market expects short-term rates to fall sharply over the next few years relative to longer-term rates.
Systematic Income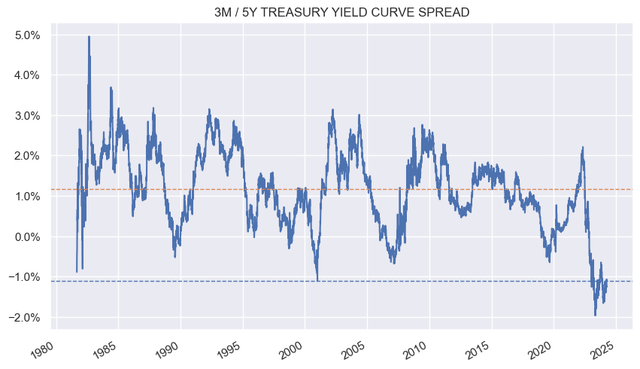
So a redemption in response to a step-up in coupon is not necessarily an obvious thing to do for issuers. This is because a redemption of a preferred that is about to switch to a floating rate will not necessarily save the issuer money even if there is a step-up in coupon on the first call date. Unless the market is wrong about the direction of short rates (shown below), longer-term fixed rates are best viewed as consensus averages of the short-term rate as a first order approximation.
Chatham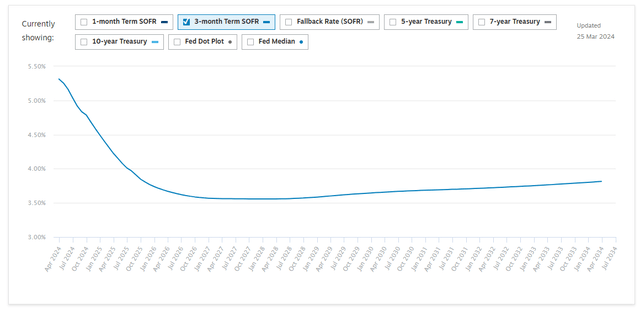
By this logic, paying a short-term rate over time is not much different than refinancing to a fixed rate, as both should end up roughly with a similar cost. Again, the market could be very wrong about the direction of rates, but it could be wrong in either direction so unless the issuer has a very precise view about the path of short-term rates that deviates markedly from the market, a redemption and a refinancing to another fixed-rate or Fix/Float preferred is not a slam dunk.
More relevant than the change in coupon for issuers deciding whether to refinance is the level of spread over the floating rate vs. the level of spreads prevalent in the preferreds sector now. As the chart below shows, preferreds spreads have fallen to around 1% in aggregate (and exchange-traded financials, in particular, look quite rich at a spread of just 0.28%). What this suggests is that issuers who think they can issue new preferreds at a spread less than the contractual spread on their Fix/Float preferreds could very well do so.
ICE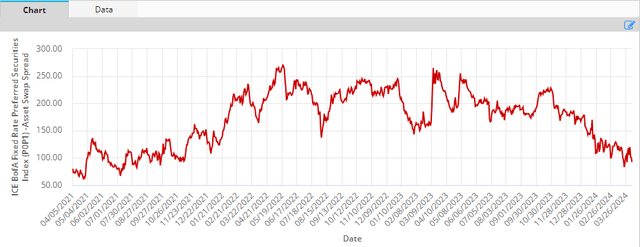
One of these is the very FHN.PR.D highlighted above. FHN got swept up in the regional bank sell-off last year, with the stock falling to as low as $16.50. Also, recall, there was a second dip when its planned merger with TD Bank fell through. If the stock were not redeemed, it would be paying a spread of more than 4% over SOFR. It is likely the bank can source financing at a cheaper rate, if not in the preferreds market, then somewhere else.
FHN.PR.D was held from April to October in our Income Portfolios, when we rotated to Synovus Financial Series E (SNV.PR.E). SNV.PR.E has a first call date in July with a coupon that resets to 5Y Treasury + 4.127%. It remains attractive as it offers a win-win – a nice tailwind in case of redemption (it trades below “par”) or a big step-up in coupon. Much like with FHN.PR.D – a redemption is not out of the question given the high spread of above 4% over the base rate. The market would likely demand less in the current environment for new issuance.
Market Commentary
Commercial real estate remains a focus of the broader market. It is one of the few sectors with a recessionary profile. The FDIC shows that the nonresidential nonfarm sector (e.g. office, retail, hotels) has seen a notable rise in stressed loans – the highest rate in a decade. Sachem is a mortgage REIT with significant exposure to the sector, and it is of interest to retail investors both as a sector bellwether as well as for its large number of exchange-traded senior securities. The company just reported disappointing results, pushing the common stock to a double-digit loss on the day though, to be fair, it’s not far off its level at the start of the year.
Sachem has a number of mitigants in its portfolio. One is that its loans are predominantly 1 year, which gives it an ability to quickly pivot away from developing slow-burn sector-specific issues. Two, its office-related exposure is around 12% with residential taking up about half the portfolio and commercial mortgages at less than 40%. Three, the company acquired a design/construction company, which can enable it to complete projects and refurbish existing properties in-house.
As far as key portfolio metrics, there were $6.4m of non-cash impairments (credit provisions) during the past year. So while revenue was up, annual net income fell by about a third from its 2022 level. This was worse than expected, causing a double-digit drop in the common stock. Non-accruals are around 17% of the portfolio; however, leverage is modest at 1.6x. Preferreds and bonds did not react a whole lot.
Sachem is another example of where the relative pricing of bonds and preferreds makes little sense. The preferred SACH-A trades at an 8.4% yield and all the bonds (see mREIT sector in the Baby Bond Tool) save for one trade at similar or much higher yields. Across the overall Sachem senior security spectrum, the shorter-maturity bonds e.g. SACC look the best at an 8.3% yield. Bond asset coverage is around 1.9x.
The fact that the portfolio is relatively short-dated means there should be enough cash coming from interest and principal to repay the bonds as they come due. The longer-maturity bonds don’t look as great and their yield pickup is somewhat thin, particularly if CRE stresses get worse.
One general point about holding mortgage REIT bonds is that they don’t have an asset coverage requirement, as they don’t fall under the 1940 Investment Company Act rules. So issuers like CEFs and BDCs would not be able to have as low an asset coverage as Sachem does. This means that all else equal, mREIT bonds require more caution from investors.
Credit: Source link