
Kelvin Murray
Thesis
The SPDR Blackstone Senior Loan ETF (SRLN) is a fixed income exchange-traded fund. The vehicle comes with an interesting name, representing a play on ‘Senior Loans’, which constitutes the underlying collateral in this ETF:
The SPDR Blackstone Senior Loan ETF (the “Fund”) seeks to provide current income consistent with the preservation of capital. In pursuing its investment objective, the Fund seeks to outperform the Markit iBoxx USD Liquid Leveraged Loan Index (the “Primary Index”) and the Morningstar LSTA U.S. Leveraged Loan 100 Index (the “Secondary Index”) by normally investing at least 80% of its net assets (plus any borrowings for investment purposes) in Senior Loans. For purposes of this 80% test, “Senior Loans” are first lien senior secured floating rate bank loans.
The fund offers investors the expertise provided by Blackstone, a premier investment manager. While Blackstone specializes in private equity, the manager does run a number of ETFs and CEFs as well.
Generally speaking, large asset managers who do both direct investments and manage credits, tend to have unique streamlined platforms which can be beneficial to ultimate investors in certain instances.
In this article, we are going to have a closer look at SRLN and its build, its historic performance and analytics, and derive an opinion on what a retail investor should do when contemplating the leveraged loan asset class.
Underlying collateral – overweight single ‘B’ loans
The ETF is overweight single-B leveraged loans, which make up over 60% of the portfolio:
Ratings (Fund Website)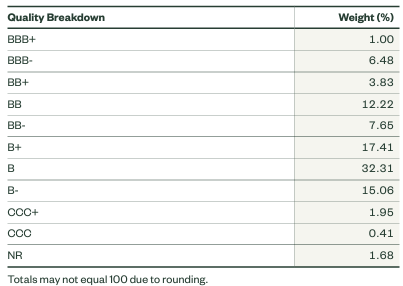
The fund, however, does not take excessive risk via its CCC bucket, which stands at only 2.36%. The portfolio is otherwise a middle-of-the-road one:
Details (Fund Fact Sheet)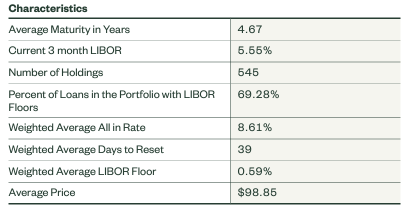
The fund has a very significant granularity, with over 545 names and a maximum per issuer concentration of 1.8%, with an average portfolio price of close to par.
The current weighted average all-in-rate is 8.61% thanks to the elevated SOFR/LIBOR levels, which are a direct derivation of Fed Funds.
Analytics – lagging behind ETF peers
When analyzing SRLN, we have to look at the fund’s analytics, especially when compared to its peer group:
Analytics (Author / Morningstar)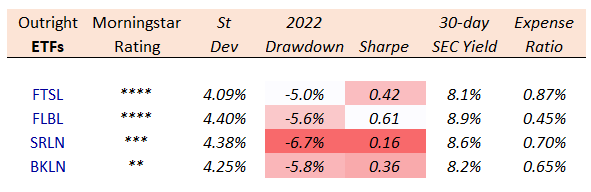
SRLN does not come cheap, with the ETF commanding a 0.7% expense ratio, towards the top rate charged by the peer group. When it comes to risk and rewards, the fund has the lowest Sharpe ratio (an investor should want a high Sharpe ratio) and the highest drawdown for 2022. On a standard deviation basis, the name compares favorably with its peer group, none of the ETFs having outsized volatility metrics.
The most encompassing metric here is the Sharpe ratio, which compares the return of an investment versus its risk. Sharpe basically normalizes various asset classes in one metric. To that end, when you buy high-yield securities, as an example, one expects a higher compensation given the higher probability of default versus investment grade. But is that compensation enough to justify the risk? That is what Sharpe takes into account, and brings to the table in a normalized ratio. The higher the Sharpe, the better. On that metric, FLBL looks best. When adding the low expense ratio, the lowest of the cohort for that matter, FLBL is the outstanding name here.
For some investors, drawdowns are also important because many individuals are loath to see negative figures in their brokerage accounts, even when these figures are temporary. The asset class as a whole is a low duration one, thus its 2022 drawdown levels were muted.
Performance – historic returns match the poor analytics
The fund’s historic total returns match its poor analytics:
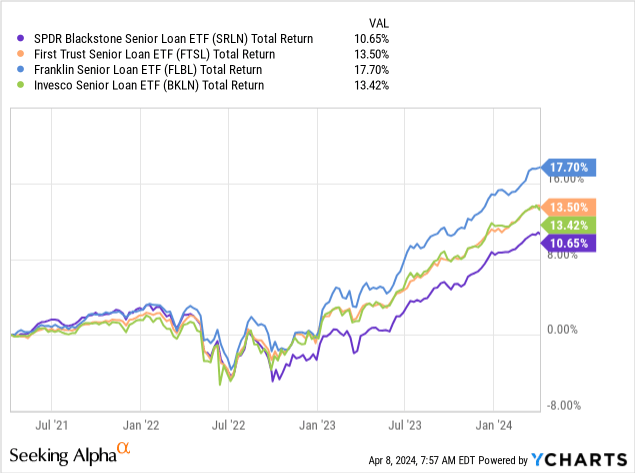
On a 3-year look-back, SRLN is dead last when compared to the First Trust Senior Loan ETF (FTSL), the Franklin Senior Loan ETF (FLBL) and the Invesco Senior Loan ETF (BKLN).
Most of the time, total returns match the analytics for a fund, and unless there is a significant change in terms of portfolio managers or strategy, one can expect this state of affairs to continue.
In the leveraged loan space, when comparing a cohort of similar funds, it comes down to individual name selection. Blackstone is not doing a good enough job here in picking winners and selecting credits which outperform the market. Unless something changes in the way individual names are selected, do expect the weakness versus its peers to persist.
This fund is an example where the collateral manager does not do a good enough job versus its peers or even the index it wants to outperform:
Performance (Fact Sheet)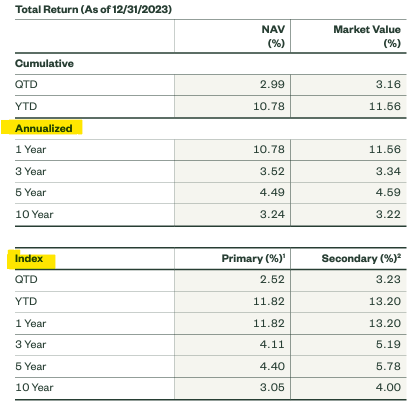
The above table has been extracted from the fund fact-sheet, where the managers are presenting their performance versus the index. The fund trails the index on a 1- and 3-year look-back, in addition to trailing its peers.
Leveraged loans are attractive until the Fed cuts rates
This year has been an interesting one, with the economy stronger than expected, and the market now pushing back its total number for Fed cuts for the year. As long as Fed Funds are high, leveraged loans are going to offer a high dividend yield. Even with 3 Fed cuts and SOFR 75 bps lower, leveraged loans will still yield somewhere close to 8%.
The story so far has been of a strong economy, so being in a floating rate asset class is a good idea until we see a significant deterioration in leading economic indicators.
While we have established that SRLN is at the bottom of its peers’ cohort, the fund is a ‘Hold’ in the current environment, still offering an attractive risk for its yield.
Conclusion
SRLN is a fixed income exchange-traded fund. The vehicle is managed by the storied Blackstone asset manager, but unfortunately fails to outperform given its pedigree. The ETF exhibits poor analytics when compared to its peer group, and even managed to underperform the leveraged loan index on a 1- and 3-year look back periods. New money looking to allocate to the leveraged loan ETF space would do well to look at FLBL, which we covered here, while existing shareholders can hold until the Fed starts cutting rates.
Credit: Source link