

John Sciulli
One company that had a fairly decent day on March 26th was watch and accessories manufacturer Movado Group, Inc. (NYSE:MOV). Shares of the business rose by about 2.7% (before closing up less than 1%) after management reported revenue and earnings for the final quarter of the company’s 2024 fiscal year that exceeded analysts’ expectations. Guidance for revenue for 2025 suggests a return to growth. But this will come at the expense of additional spending on advertising.
If we adjust for this, shares of the Movado Group business still do look attractively priced. That is why, despite seeing the stock rise by only 1.1% since I last wrote a bullish article about it in June of 2023 compared to the 18.2% increase seen by the S&P 500 over the same window of time, I believe that the “buy” rating I assigned it still makes sense.
Interesting times
Before the market opened on March 26th, the management team at Movado Group announced financial results covering the final quarter of the firm’s 2024 fiscal year. For those not terribly familiar with the business, it focuses on the production and sale of watches and related accessories across the globe. It owns a variety of its brands such as Movado, Concord, Ebel, Olivia Burton, and MVMT. However, it also licenses brands like Coach, Tommy Hilfiger, Hugo Boss, Lacoste, and Calvin Klein Some of the other products that it sells includes jewelry and related accessories. But those account for only a small portion of overall sales.
Movado Group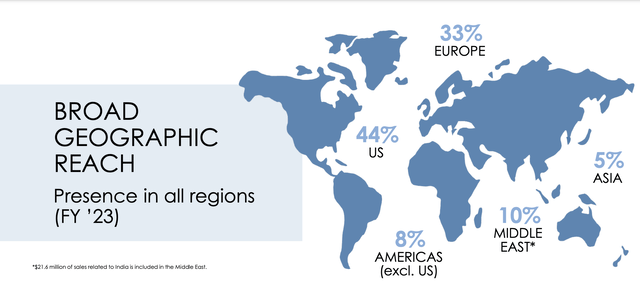
Operationally speaking, the firm has quite a large network. 44% of its revenue is generated in the U.S. Unsurprisingly, another 33% comes from Europe. However, the firm does generate another 10% of sales from the Middle East, 5% from Asia, and 8% from the Americas that does not include the U.S. In terms of overall sales concentration, 55% involve the unlicensed brands that I listed. 31% involves brands that the company owns. The firm does have its own stores that account for about 15% of revenue, while the remaining 1% of sales involves after-sales services and all other activities that the enterprise engages in.
Movado Group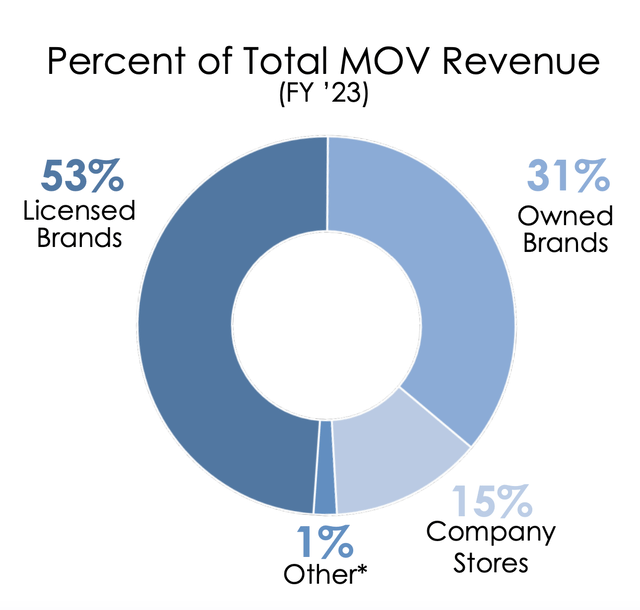
Recently, financial performance achieved by the company has been a bit disappointing. But even that is relative. Let’s take the final quarter of the 2024 fiscal year as an example. Sales for that time totaled $179.6 million. That’s a decline of 7.6% compared to the $194.3 million generated one year earlier. All major sales channels, including wholesale customers operating brick and mortar stores, online retail providers, and the firm’s own locations, reported weakness year-over-year. In the U.S., revenue took a 12.4% dive.
Author – SEC EDGAR Data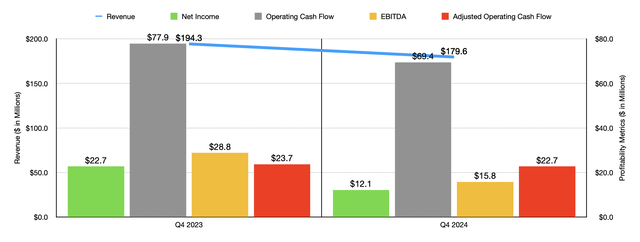
Management did not really provide any meaningful context as to why this occurred. The only thing they stated was that it was because of lower demand. To be honest, considering the inflationary environment that we are in, it makes sense that people would cut back on an item that many consider to be a luxury. I would argue, however, that this is likely temporary. In the U.S., the watch market was worth about $13.6 billion in 2020. It’s expected to rise to $17.8 billion by 2026. And from 2020 to 2025, the industry on a global scale should grow from $61.9 billion to $117.8 billion.
Author – SEC EDGAR Data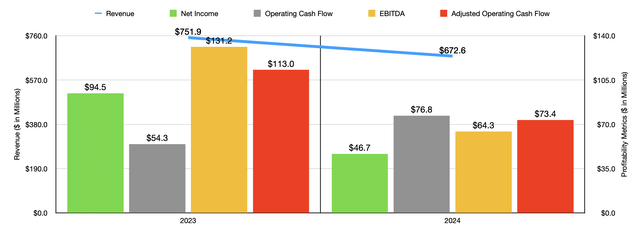
For now, however, investors are having to deal with a bit of pain. And that pain has extended to the firm’s bottom line. During the most recent quarter, net profits dipped to $12.1 million. That’s a little more than half the $22.7 million generated one year earlier. Other profitability metrics also took a hit. Operating cash flow fell from $77.9 million to $69.4 million. If we adjust for changes in working capital, we would get a decline from $23.7 million to $22.7 million. And finally, EBITDA for the business fell from $28.8 million to $15.8 million.
In the chart above, you can see financial results for 2024 as a whole relative to 2023. This shows much of the same picture, with revenue, profits, and two of the three cash flow metrics for the company worsening year over year. So, this has not been just the blip on the radar. If anything, it is part of a larger trend.
Despite the pain that the company experienced in the final quarter of 2024, the results posted by management actually exceeded analysts’ guidance. Sales exceeded forecasts by approximately $4.8 million. Meanwhile, earnings per share of $0.53 comfortably exceeded the $0.39 per share, for a beat of $0.14 per share, that analysts were anticipating. This is comforting, because it shows that the picture is not as weak as market participants expected it would be. It also shows that management has been successful in keeping some of its cost items down during these particularly painful times.
When it comes to the 2025 fiscal year, management expects a turnaround in revenue. They are currently forecasting sales of between $700 million and $710 million. At the midpoint, this would be 4.8% above the $672.6 million generated in 2024. But this comes at a cost. You see, management has said that they expect to increase their marketing budget by $25 million for the year. As a result of this, earnings per share for the year are forecasted to be between $1.20 and $1.30.
If we assume that the firm’s share count remains unchanged, then hitting the midpoint would translate to net profits of only $28.3 million. That’s well below the $46.7 million reported for 2024. But if we add back the $25 million voluntary marketing increase and adjust for the 22% tax rate management forecasted for the year, we would get adjusted net profits of $47.8 million. This would imply just an operating cash flow of around $75.1 million and EBITDA of $65.8 million.
Author – SEC EDGAR Data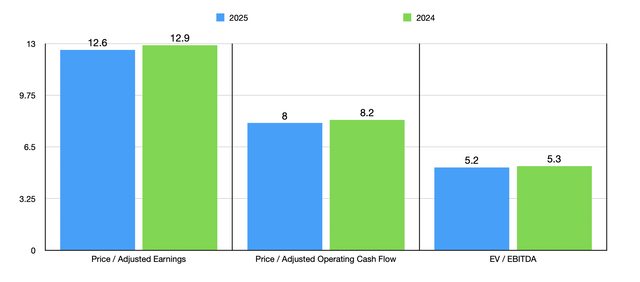
Using these results, valuing the company becomes a very simple process. In the chart above, you can see precisely what I mean. While the stock might look more or less fairly valued compared to earnings, it does look cheap on an absolute basis relative to cash flows. The reason why the EV to EBITDA multiple is so low, by the way, is because the company has no debt on its books and it enjoys $262.1 million in cash and cash equivalents. This gives it plenty of wiggle room to work with and materially reduces the risk for shareholders.
It also gives the company plenty of fuel to work with when it comes to share buybacks. But so far, management has been a bit gun shy on that. During the 2024 fiscal year, the firm repurchased only $3.1 million worth of units. That’s well below the $31.4 million that the company bought back during the 2023 fiscal year. And with only $17.9 million remaining under its $50 million share buyback program, it remains to be seen whether management will step up repurchases or not.
| Company | Price / Earnings | Price / Operating Cash Flow | EV / EBITDA |
| Movado Group | 12.9 | 8.2 | 5.3 |
| G-III Apparel Group (GIII) | 4.5 | 2.5 | 5.2 |
| Superior Group of Companies (SGC) | 30.2 | 3.4 | 10.6 |
| Delta Apparel (DLA) | 6.3 | 0.5 | 37.9 |
| Vera Bradley (VRA) | 11.3 | 4.5 | 1.8 |
| Signet Jewelers (SIG) | 6.6 | 9.2 | 4.6 |
As part of my analysis, I then compared the company to five similar firms. These can be seen in the table above. On both a price to earnings basis and a price to operating cash flow basis, I found that four of the five companies ended up being cheaper than Movado Group. This number does drop to three of the five when looking at the picture through the lens of the EV to EBITDA multiple.
Takeaway
Given that, relative to similar firms, Movado Group shares looks to be a bit pricey, and considering the decline in revenue, profits, and cash flows, that the company saw in the final quarter of the 2024 fiscal year, you might think that I would be here to downgrade the business.
But that’s not my intention.
On an absolute basis, Movado Group, Inc. shares are very affordable, and management has a plan to boost revenue moving forward. The firm’s excess cash makes it a highly stable prospect that has a very low level of risk in the near term. To me, these factors, all combined, outweigh the negatives. This is especially true when you consider that financial results for the most recent quarter exceeded analysts’ forecast. Due to these reasons, I believe that keeping the company rated a “buy” is a fine idea at this point in time.
Editor’s Note: This article discusses one or more securities that do not trade on a major U.S. exchange. Please be aware of the risks associated with these stocks.
Credit: Source link