

adventtr
About the Company
Elevance Health (NYSE:ELV) is a provider of health plans but also includes CarelonRx which is its pharmacy benefits manager. CarelonRx was created and launched during Anthem’s rebranding to Elevance in mid-2022. Additionally, Elevance is also a licensee of Blue Cross and Blue Shield name with business operations in 13 states and up until recently was set to acquire Blue Cross Blue Shield of Louisiana, however; in just the past month this transaction was put on hold so BCBSLA could further assess the deal. Elevance has lagged quite a bit behind the S&P 500 ETF Trust (SPY) over the past year with a return of 10.13%; however, SPY has returned an impressive 32.19%. I believe this company is a great investment and ELV’s lack of price appreciation over the past year provides investors with a good entry point right now.
Financial Metrics
As you can see from the chart below, Elevance has grown its revenue extremely well over the past five years, with a compound annual growth rate of more than 13.5%. The company’s largest increase occurred between 2019 and 2020 when it jumped more than 17%, while its lowest increase was still a very respectable 9.4% from 2022 to 2023. During Elevance’s 2023 fourth quarter earnings call in late January, the company mentioned that it projects 2024 revenue just north of 170 billion, which would be essentially flat or a minimal decrease compared to 2023.
Elevance’s Annual Reports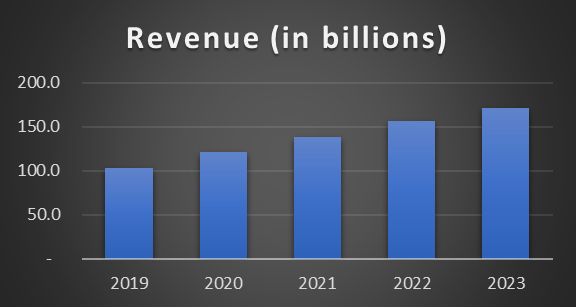
Given that Elevance has more than one segment, I always think it’s beneficial to break out the segments and see which areas of the company are growing. As clearly shown in the chart below, their HealthCare segment makes up the majority of the revenue, followed by CarelonRx, Carelon Services then Corporate & Other. The HealthCare portion has grown revenue at a CAGR of 10.5% since 2021. The percentage of revenue that segment contributes to the overall number has dipped slightly from 89% in 2021 and 2022, to 87% in 2023. CarelonRx has seen the most consistent and increasing segment revenue growth over the past few years, with 12.2% growth in 2022 and 18.6% growth in 2023. Carelon Services has also seen impressive growth in recent years with a compound annual growth rate of 18.1%; however, it currently contributes less than 10% of revenue to the overall company.
Elevance’s Annual Reports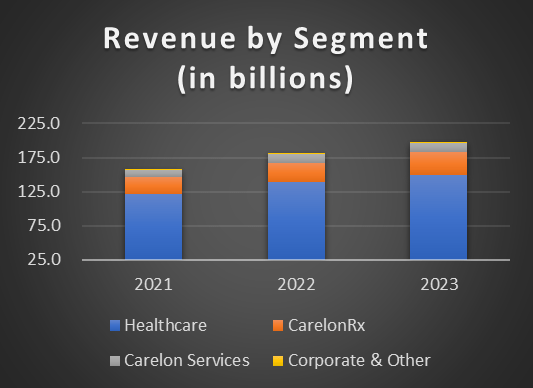
(Note: the Corporate & Other portion of the company contributes an immaterial amount of revenue and thus was not discussed. Additionally, when comparing the revenue by segment to the revenue chart above there are differences when looking at each individual year. This occurs due to eliminations related to accounting transactions which are made between subsidiary companies).
Elevance’s earnings per share have been inconsistent over the past five years with a low in 2020 at $17.98 and high in 2023 of $25.22. Its biggest increase, year-over-year, occurred from 2020 to 2021 when it jumped nearly 40%. Since then, the company has struggled to grow earnings per share in a meaningful way, with a decrease of 2.69% from 2021 to 2022 and an approximate 4% increase from 2022 to 2023. Overall, this metric is trending in the right direction and has a compound annual growth rate of 8% since 2019; however, management has an ambitious goal of 12%-15% earnings growth for the foreseeable future.
Elevance’s Annual Reports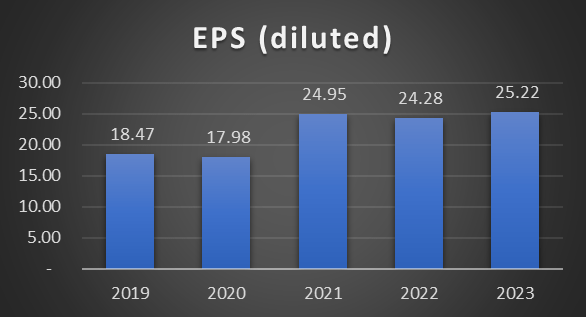
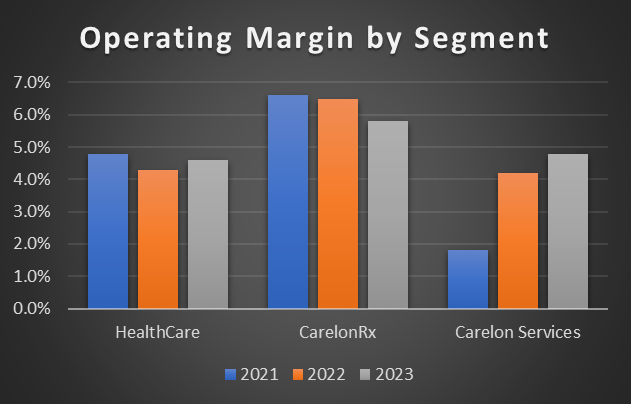
The operating margin is the last financial metric I want to discuss which has been inconsistent and on a steady decline over the past five years. The company’s operating margin peaked in 2019 at 6.46% before dropping off in 2023 to just north of 5%. When looking at the second chart below, you can see the segment operating margins. The smallest segment has shown the greatest improvement in operating margin with Carelon Services increasing their operating margin to 4.8% in 2023 up from just 1.8% in 2021. It is imperative a company is able to at least maintain their operating margin (if not increase it), which makes ELV’s inconsistency something to watch.
Elevance’s Annual Reports Elevance’s Annual Reports.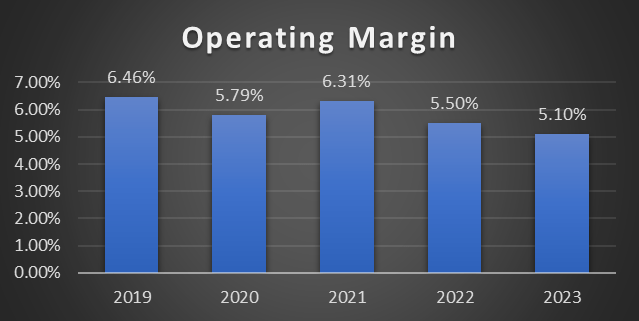
The Dividend
Elevance has paid a growing dividend for the past 13 years and a little more than a month ago raised its dividend by 10% to $1.63 per quarter. The company has done an exceptional job with growing its dividend with their 3-, 5-, and 10-year CAGRs all hovering around 15%. Also, Seeking Alpha’s Quant grades Elevance’s growth and safety as A and A+ respectively, while the yield and history are a B- and B respectively. The payout ratio over the last five years has been below management’s target of 20%, leaving sufficient room for future dividend growth. ELV’s forward yield of 1.26% lags when compared to its closest peers; United Healthcare (UNH) and The Cigna Group (CI) both top 1.50% forward yield; however, Humana’s (HUM) is really struggling at just 1.01%. Overall, ELV pays a respectable yield and provides its shareholders with above average dividend growth, and while this is not the strongest element for ELV it is close to its competitors.
Valuation
To determine if a stock is possibly over or undervalued, I use two methods. The first is dividend yield theory, which is based on the premise that if the current yield is higher than its historical yield, the company is undervalued, and vice versa if the yield is lower. The other method is more common, and it is the price to earnings ratio, which is calculated by dividing the current price by the earnings per share for the prior twelve months. While neither is an exact science, they are a quick way to see if a company is worthy of further research.
Coming out of the severity of the pandemic, ELV’s yield came close to topping 2% which it had not done since late 2016. Immediately after, the yield dropped significantly and continued to drop until early 2020. Following that, the yield remained relatively close to the four year average from late 2021 through early 2023 where it remained close to or right above 1%. Over the past year the yield was only slightly above the four year average and only recently dropped below the average again.
Self-created using data from Zacks.com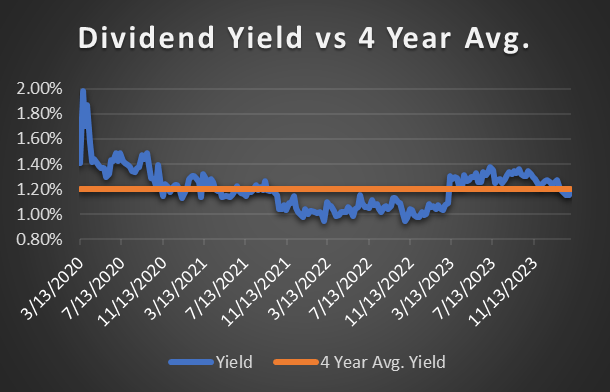
The price to earnings ratio looks virtually the opposite of the historical yield chart. It spent the first portion of the time period below its average before shooting up and spending the better part of two years above its four year average. Similarly to the yield chart, the past year would have been an ideal time to buy based on this chart, an opportunity that had not occurred since early 2021. Given management’s 2024 diluted earnings per share guidance of $34.29, combined with the price to earnings average of about 15.5 this gives us an approximate value of about $530 per share or about 4% higher than its current share price.
Self-created using data from Zacks.com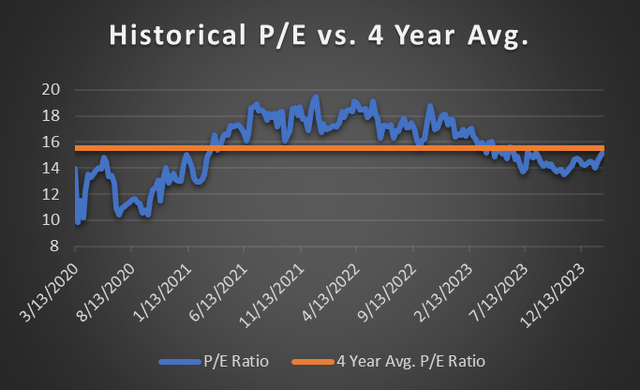
Risks
There are a couple risks associated with health insurance providers, the first one being government regulations. This is due to the fact that healthcare costs have come under intense scrutiny in recent years and was a significant talking point of the democratic party during the last presidential election. I expect this to be brought up again during the new election cycle and pressure put on the high costs as well as the lack of price transparency in this area of the market. Additionally, but to a lesser extent, I view universal health coverage (aka Medicare for all) as a long term risk to Elevance, this has also been a topic of discussion in recent years but less extreme proposals were accepted. Strong support and eventual acceptance in “Medicare for all” would more than likely be disastrous, not just for Elevance but for all health insurance providers. One final risk relates to one of ELV’s competitors and that is United Healthcare’s subsidiary Change Healthcare and it being targeted for a cyberattack within the past month. This is basically a risk with any company; however, I feel as though companies in the medical arena could be uniquely targeted given the vast amount of individual’s information they hold. Unfortunately, cyber-attacks are very prevalent now and Elevance should do whatever is necessary to protect its customers and itself from such a potentially devastating situation.
Final Thoughts
Elevance is off to a solid 2024 year with its stock up more than 9% thus far. The company and its industry as a whole has been facing ongoing pressure from the government regarding the affordability of healthcare as well price transparency. However, Elevance has continued to impress with its strategic acquisitions and their financial metrics generally trending in the right direction. Currently, I believe the company is a buy and barring any significant government intervention in their industry, should reward shareholders with above average price appreciation and sound dividend growth.
Credit: Source link