
• bitcoinBitcoin(BTC)$77,897.001.40%
  • ethereumEthereum(ETH)$2,512.851.26%
  • tetherTether(USDT)$1.00-0.01%
  • binancecoinBNB(BNB)$722.290.81%
  • rippleXRP(XRP)$1.403.99%
  • usd-coinUSDC(USDC)$1.000.00%
  • solanaSolana(SOL)$101.691.96%
  • tronTRON(TRX)$0.340185-0.18%
  • Figure HelocFigure Heloc(FIGR_HELOC)$1.020.00%
  • zcashZcash(ZEC)$1,132.493.71%
  • HyperliquidHyperliquid(HYPE)$80.483.76%
  • dogecoinDogecoin(DOGE)$0.0842190.82%
  • RainRain(RAIN)$0.015077-1.84%
  • USDSUSDS(USDS)$1.000.00%
  • moneroMonero(XMR)$513.09-3.94%
  • whitebitWhiteBIT Coin(WBT)$80.651.21%
  • chainlinkChainlink(LINK)$11.390.96%
  • leo-tokenLEO Token(LEO)$8.96-1.05%
  • cardanoCardano(ADA)$0.2097042.35%
  • stellarStellar(XLM)$0.1909067.09%
  • Ethena USDeEthena USDe(USDE)$1.00-0.01%
  • daiDai(DAI)$1.00-0.01%
  • bitcoin-cashBitcoin Cash(BCH)$222.81-0.48%
  • USD1USD1(USD1)$1.00-0.01%
  • litecoinLitecoin(LTC)$53.640.09%
  • uniswapUniswap(UNI)$6.300.59%
  • CantonCanton(CC)$0.0961261.07%
  • the-open-networkGram (prev. Toncoin)(GRAM)$1.350.29%
  • hedera-hashgraphHedera(HBAR)$0.0773662.45%
  • avalanche-2Avalanche(AVAX)$7.522.56%
  • Global DollarGlobal Dollar(USDG)$1.000.00%
  • nearNEAR Protocol(NEAR)$2.425.04%
  • shiba-inuShiba Inu(SHIB)$0.0000051.07%
  • suiSui(SUI)$0.731.98%
  • crypto-com-chainCronos(CRO)$0.0601052.44%
  • paypal-usdPayPal USD(PYUSD)$1.000.00%
  • BlackRock USD Institutional Digital Liquidity FundBlackRock USD Institutional Digital Liquidity Fund(BUIDL)$1.000.00%
  • tether-goldTether Gold(XAUT)$4,289.56-1.35%
  • BittensorBittensor(TAO)$235.100.33%
  • Circle USYCCircle USYC(USYC)$1.140.01%
  • MemeCoreMemeCore(M)$1.14-0.49%
  • okbOKB(OKB)$113.910.52%
  • Ripple USDRipple USD(RLUSD)$1.000.00%
  • Ondo US Dollar YieldOndo US Dollar Yield(USDY)$1.150.05%
  • aaveAave(AAVE)$126.231.68%
  • AsterAster(ASTER)$0.700.71%
  • BitwayBitway(BTW)$0.69-2.45%
  • mantleMantle(MNT)$0.571.09%
  • pax-goldPAX Gold(PAXG)$4,295.44-1.31%
  • World Liberty FinancialWorld Liberty Financial(WLFI)$0.057232-1.19%
TradePoint.io
  • Main
  • AI & Technology
  • Stock Charts
  • Market & News
  • Business
  • Finance Tips
  • Trade Tube
  • Blog
  • Shop
No Result
View All Result
TradePoint.io
No Result
View All Result

High Yield Bonds Hit All-Time Total Return Highs, Weak HYG Risk/Reward (NYSEARCA:HYG)

March 18, 2024
in Market & News
Reading Time: 6 mins read
A A
High Yield Bonds Hit All-Time Total Return Highs, Weak HYG Risk/Reward (NYSEARCA:HYG)
ShareShareShareShareShare

tadamichi

YOU MAY ALSO LIKE

Philippine coast guard rescues passengers after ferry fire

Hewlett Packard Enterprise: At 16x FCF Stock Looks Ready To Inflect Higher (NYSE:HPE)

What a wild few years it has been in the fixed-income markets. The Fed began its rate-hiking campaign about this time in 2022 – a period of rising equity market volatility, surging crude oil prices, and a strengthening dollar. Today, Treasury volatility has eased, with the ICE BofA MOVE Index not far from 52-week lows while the VIX is subdued near 15.

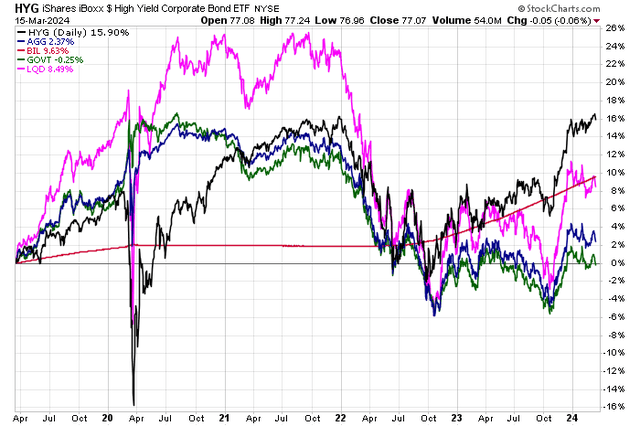
Zoom out, though, and you’ll see a set of varying Treasury and credit returns. Only T-bills and junk bonds are not in total return drawdowns. Let’s home in on the high yield space by analyzing the iShares iBoxx $ High Yield Corporate Bond ETF (NYSEARCA:HYG).

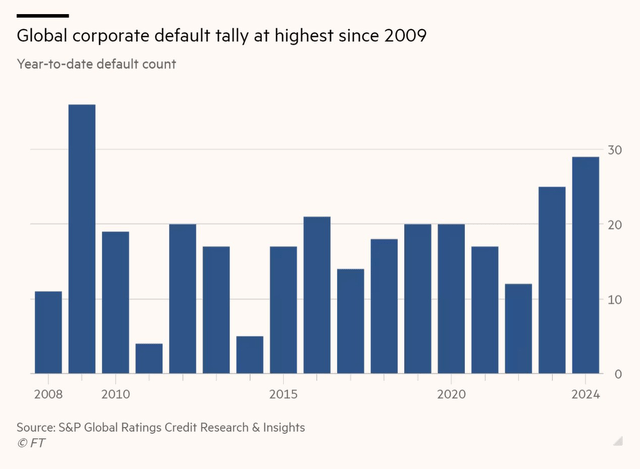
I have a hold rating on the HYG fund – spreads are near cycle tights while corporate defaults are on the rise. That is not a lucrative risk/reward situation for HYG.

HYG & T-Bills Reach Fresh All-Time Total Return Highs, IG Credit, the Agg, and the Total Treasury Index Remain in Drawdowns

HYG & T-Bills Reach Fresh All-Time Total Return Highs, IG Credit, the Agg, and the Total Treasury Index Remain in Drawdowns

Stockcharts.com
Corporate Defaults on the Rise

Corporate Defaults on the Rise

FT

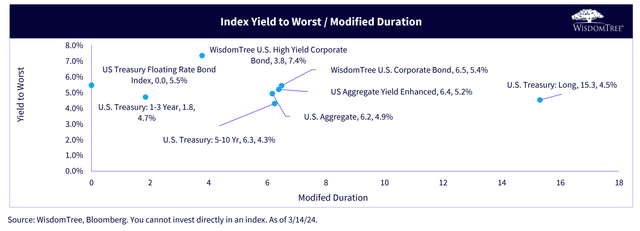
My weekly market review includes a look at the WisdomTree daily dashboard. One of the most telling visuals is a chart with the yield to worst on the y-axis and modified duration on the x-axis. You will find that junk bonds feature a lower duration than investment-grade credit.

The high-yield space currently sports a yield-to-worst of around 7.4% – that’s about two percentage points below where they were during the middle of last year. As market interest rates have ebbed from their 2023 highs and confidence has improved in the riskiest niche of the corporate bond market, there is less yield to be had in something like HYG.

US HY YTW Under 8%, Less Yield Compared to Year-Ago Levels

US HY YTW Under 8%, Less Yield Compared to Year-Ago Levels

WisdomTree
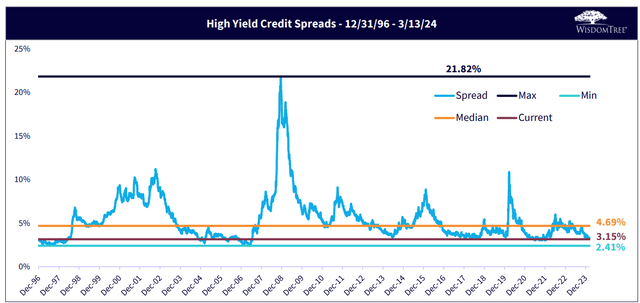
To illustrate the point, WisdomTree’s data show that high-yield credit spreads are indeed near cycle tights. That is a bullish indicator for stocks, as it underscores high optimism in American corporations’ ability to fulfill its debt obligations, but any hiccups in solvency metrics or mere sentiment could result in a significant rise in spreads, which would be bearish high-yield bond prices.

US HY Spreads Near Cycle Tights

US HY Spreads Near Cycle Tights

WisdomTree
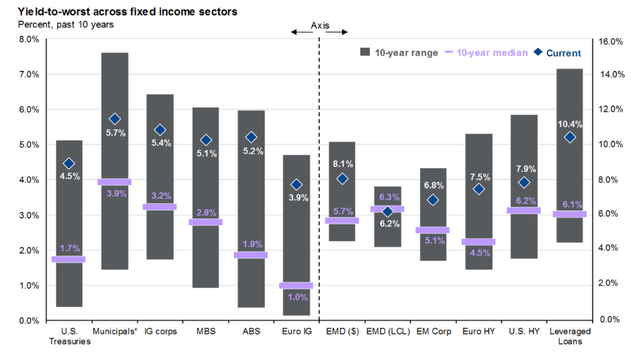
The good news for diversified bond investors is that most areas of fixed income offer much beefier yield today compared with the average of the 2010s. Over the past 10 years, the average yield to worst on HYG is 6.2% compared with today’s rate above 7%. I encourage investors to consider European high-yield bonds or domestic leveraged loans – both slices of the global fixed-income market are still relatively attractive. If HYG’s YTW climbs back toward 10%, then it becomes more attractive. Of course, equities might then be a better value, too.

Fixed Income YTW Today Versus History

Fixed Income YTW Today Versus History

JPM
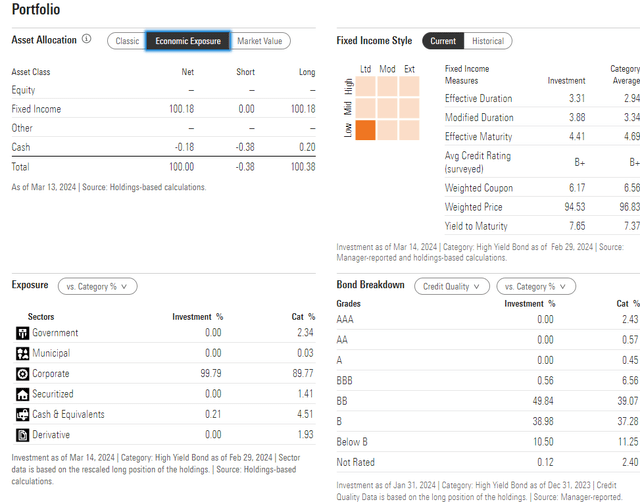
As for HYG itself, the 3-star, Neutral-rated ETF by Morningstar plots in the lower left section of the fixed income style box. Its current effective duration is 3.31 years – that’s relatively low compared to high-grade credit, so there is significantly less interest rate sensitivity and more credit risk. Expect HYG to have a higher correlation than investment-grade bonds to the stock market. HYG is not the absolute riskiest portfolio, however. Half of the allocation is rated BB, barely below investment grade and just 11% is below B.

HYG: Portfolio Breakdown

HYG: Portfolio Breakdown

Morningstar

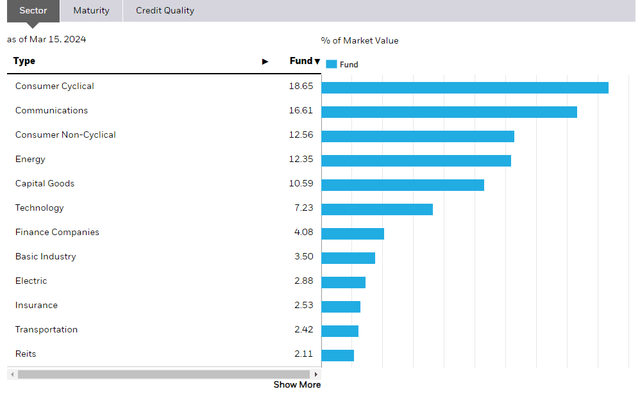
Sector-wise, there’s ample diversification with HYG, helping to limit risk metrics. According to iShares, 19% of the portfolio is comprised of the Consumer Discretionary sector with 17% allocated to Communication Services. Energy was once a large chunk of the junk bond index, but many oil & gas names were consolidated in the late 2010s and early 2020s, and capital discipline is much tighter in that niche of the corporate world.

HYG: Sector Composition

HYG: Sector Composition

iShares

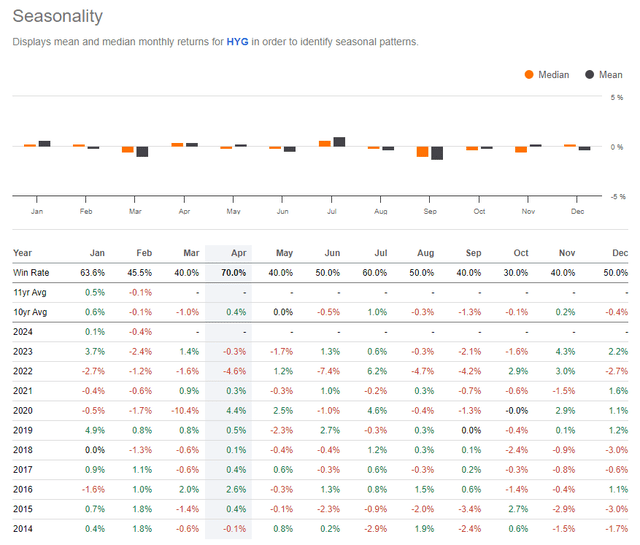
With weak share-price momentum and high liquidity, HYG tends to perform well in April, according to Seeking Alpha’s seasonality tool, but gains are not all that high. Prospective investors should be wary of the August through October stretch, though.

HYG: Neutral Seasonal Trends

HYG: Neutral Seasonal Trends

Seeking Alpha
The Technical Take

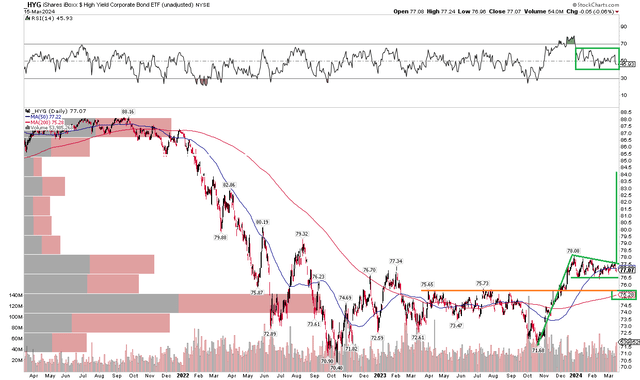
The $16.8 billion ETF looks strong on the chart despite a smaller yield today. Notice in the graph below that shares are in a bullish descending triangle pattern after rallying from lows notched last October. We can project an upside target based on the height of the previous rally, added on top of the potential breakout point. So, take $6.40 and tack that on to about $78 to yield a bullish measured move price objective of $84.60 if we see a breakout transpire. That would bring HYG close to its late 2021 lows – an area of overhead supply that would also be an understandable selling pressure zone.

Also take a look at the RSI momentum gauge at the top of the chart – while it’s off the highs, it has not fallen off too much. So long as the RSI momentum oscillator holds above 40, the bulls should maintain their control. Support that assertion is the rising 200-day moving average. Price is above that trend indicator line and has been since a golden cross pattern took place last December.

Overall, support is seen between $75 and $76, while $78 could be a minor resistance point.

HYG: Bullish Descending Triangle, RSI Hanging In There

HYG: Bullish Descending Triangle, RSI Hanging In There

Stockcharts.com
The Bottom Line

I have a hold rating on iShares iBoxx $ High Yield Corporate Bond ETF. With tight credit spreads and a lower yield compared to a year ago, I would rather reduce default risk with high-grade corporates or by simply allocating my bond sleeve to short or intermediate-term Treasuries. While HYG’s technical chart is solid and the fund is at a total return all-time high, the risk/reward setup is not ideal today.

Credit: Source link

ShareTweetSendSharePin

Related Posts

Philippine coast guard rescues passengers after ferry fire
Market & News

Philippine coast guard rescues passengers after ferry fire

September 14, 2026
Hewlett Packard Enterprise: At 16x FCF Stock Looks Ready To Inflect Higher (NYSE:HPE)
Market & News

Hewlett Packard Enterprise: At 16x FCF Stock Looks Ready To Inflect Higher (NYSE:HPE)

September 14, 2026
Full speech: President Trump’s address at the Republican midterm convention
Market & News

Full speech: President Trump’s address at the Republican midterm convention

September 14, 2026
Trump k ‘dividend’ proposal may not be possible legally and financially
Market & News

Trump $5k ‘dividend’ proposal may not be possible legally and financially

September 14, 2026
Next Post
U.S. and G-7 allies agree to send F-16 fighter jets to Ukraine

U.S. and G-7 allies agree to send F-16 fighter jets to Ukraine

Leave a Reply Cancel reply

Your email address will not be published. Required fields are marked *

Search

No Result
View All Result
LIVE: Vance, Trump deliver remarks at the Republican midterm convention | NBC News

LIVE: Vance, Trump deliver remarks at the Republican midterm convention | NBC News

September 13, 2026
Proskauer Rose law firm adds 2 more floors at 11 Times Square

Proskauer Rose law firm adds 2 more floors at 11 Times Square

September 13, 2026
College football picks: Predictions against the spread, odds, betting lines for top 25 games in Week 2 – cbssports.com

College football picks: Predictions against the spread, odds, betting lines for top 25 games in Week 2 – cbssports.com

September 12, 2026

About

Learn more

Our Services

Legal

Privacy Policy

Terms of Use

Bloggers

Learn more

Article Links

Contact

Advertise

Ask us anything

©2020- TradePoint.io - All rights reserved!

Tradepoint.io, being just a publishing and technology platform, is not a registered broker-dealer or investment adviser. So we do not provide investment advice. Rather, brokerage services are provided to clients of Tradepoint.io by independent SEC-registered broker-dealers and members of FINRA/SIPC. Every form of investing carries some risk and past performance is not a guarantee of future results. “Tradepoint.io“, “Instant Investing” and “My Trading Tools” are registered trademarks of Apperbuild, LLC.

This website is operated by Apperbuild, LLC. We have no link to any brokerage firm and we do not provide investment advice. Every information and resource we provide is solely for the education of our readers. © 2020 Apperbuild, LLC. All rights reserved.

No Result
View All Result
  • Main
  • AI & Technology
  • Stock Charts
  • Market & News
  • Business
  • Finance Tips
  • Trade Tube
  • Blog
  • Shop

© 2023 - TradePoint.io - All Rights Reserved!