
































NejauPhoto
Among the very large universe of ETFs available in the market, only a few qualify as “complete-package”, well-diversified growth funds, in my view. The Risk Parity ETF (RPAR), which I talked about recently, is perhaps my favorite one, despite its pitiful performance in 2022. But the Amplify BlackSwan Growth & Treasury Core ETF (NYSEARCA:SWAN) has to be a close second.
Amplify’s leveraged stock-and-bond strategy remains quite a bit underwater: 24% below the November 2021 peak levels. However, the ETF has been having a decent 2024 so far, as the chart below suggests: up 4% YTD and 19% since the October 2023 bottom. It has outperformed RPAR by a good bit, despite both funds sharing more fundamental similarities than differences.
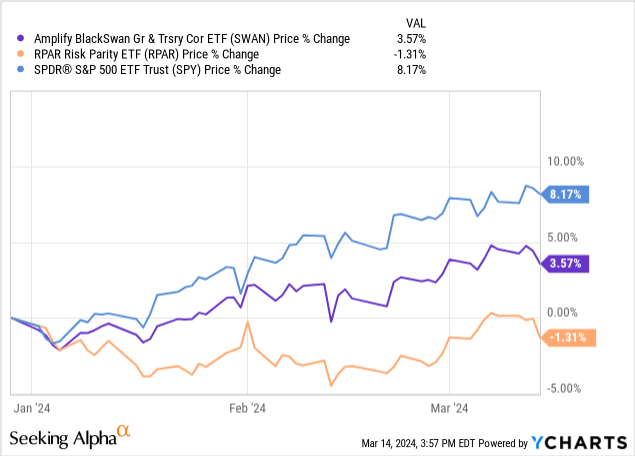
In line with my opinion published nearly 12 months ago, I continue to think that owning SWAN today makes a lot of sense for the reasons that I will explain in more detail below. However, investors should be aware of a catch that could increase risk in the short term – i.e., the next three to four months – and possibly cause SWAN to simply behave very much like the S&P 500 itself.
What Is SWAN?
SWAN is a diversified stock-and-government bond fund of sorts but with improvements over the traditional 60/40 approach with which most of us are very familiar. These improvements include:
- Rather than allocating more notional value to stocks than bonds, as is the case of the standard 60/40 strategy, SWAN risk balances the exposure better by putting more weight on safer treasuries and less on stocks.
- SWAN uses leverage to increase the expected return (and the risk, mind you) of the portfolio by a factor of about 1.5x, thus making the ETF more appropriate for investors looking for long-term growth. Therefore, in practice, SWAN is not a 60/40 stock-and-bond strategy, but a 60/90 portfolio instead (60 plus 90 equals 150, which is the leverage factor).
- Lastly, SWAN’s exposure to US stocks is achieved through long positions in delta-70 S&P 500 (SPY) call options. Doing so allows the fund manager to (1) achieve the desired leverage while (2) limiting the maximum possible loss associated with the stock market exposure to the premium paid on the call options.
As of the writing of this article, SWAN’s notional was invested as follows:
DM Martins Research, data from Amplify ETFs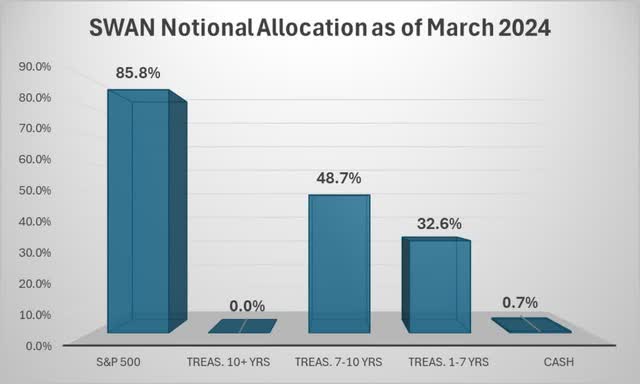
Of course, an investment in SWAN is not without meaningful risks. While the ETF’s losses associated with a decline in the S&P 500 are capped (hence the “black swan” reference in the fund’s name), as explained above, they can still occur and wipe out up to 10% or 12% of the AUM.
Also, a decline in treasury prices would result in an ETF share price decline, which could be meaningful. In fact, 2022 provided the best example to date of how SWAN can be severely harmed by a bear market in bonds. With 10-year treasuries having lost about 15% of their market value in 2022, probably the most in 100 years or more, SWAN dipped 27% in that same year.
Why Own SWAN (And What Is The Catch)?
Owning SWAN makes sense to me for the same reasons that RPAR does as well. Therefore, I could simply copy and paste my bullish views on the Risk Parity ETF, and I’d probably be capturing the lion’s share of the bullish case for SWAN. As a quick recap:
- I believe that a leveraged three-parts treasury, two-parts stock portfolio is likely to produce noticeably better risk-adjusted (and maybe even absolute) returns in the very long term vs. the S&P 500. The strategy is better balanced and positioned to produce higher returns during down cycles in the economy.
- SWAN and its cousin RPAR took a massive hit in 2022 due to their exposure to treasuries, which in turn suffered the most in a century from rapidly rising interest rates. But when it comes to bonds, pain in the rearview mirror usually means profits through the windshield, since future returns are roughly equal to the yield on those bonds at the time of purchase (i.e., about 4.0% today for 10-year treasuries vs. only 0.5% around mid-2020).
- Considering a steady-state risk-free rate of 3%, an equity risk premium of 5.5%, and a treasury yield of 4%, I believe that a 1.5x leveraged fund like SWAN should produce roughly 8% per year over time, already discounting the hedge cost on the SPY calls. This is quite compelling, in my view, for a well-diversified strategy.
The catch is that SWAN could behave a bit more erratically in the next few months. The fund currently holds two batches of SPY call options with deltas 0.86 and 0.97, much higher than the target delta of 0.70. This is the case because the portfolio rebalances every six months only (the next will happen in June).
Since the last rebalance, the S&P 500 climbed substantially: up 7% YTD and 26% in the past 12 months. This is why the notional amount in SWAN exposed to the S&P 500 is currently 86%, as displayed in the chart above, and not 60% as one might expect. It may also explain, in great part, why SWAN has done so much better than RPAR so far in 2024, despite the fairly similar strategies.
So, keep in mind: SWAN might behave more like the S&P 500 in the foreseeable future due to (1) the higher exposure to equities at this moment and (2) the higher option deltas, which means that a $1 change in the S&P 500 will impact SWAN by nearly $1.
This could add risk to the investment in the short term but does not change my bullish stance toward SWAN in the long term.
Credit: Source link