

Kira88
Fundamentals
Let’s take a deeper look in the fascinating world of gold and how it interacts with the economy, shall we?
You know, gold isn’t just a shiny metal; it’s like your trusty sidekick in the financial world, especially when inflation starts creeping up. Picture this: while your regular cash might lose its value when prices go up, gold stands strong and holds onto its worth like a champ. That’s why investors often turn to gold as a safe haven during times of economic uncertainty.
Now, let’s talk about interest rates. When they’re climbing up, gold might not seem as appealing compared to other investments that promise higher returns, like bonds. That’s because gold doesn’t pay out any interest on its own, so when rates rise, investors might shift their focus elsewhere.
But here’s where it gets interesting: right now, the Federal Reserve is doing its thing, slowly increasing interest rates to keep inflation in check. And while you might think this would dull gold’s sparkle, recent reports on inflation, such as the Consumer Price Index (CPI) and Producer Price Index (PPI), have been turning heads by showing inflation numbers that are even higher than expected.
Now, this news gave gold a bit of a reality check, causing it to take a breather from its recent highs. But here’s the kicker: despite this, gold has been showing some serious backbone by holding steady above the $2150 mark. It’s like saying, “Hey, I’m not going down without a fight!”
Looking ahead, all eyes are on the Federal Reserve’s March meeting. Now, don’t expect any rate cuts just yet, but we’re all eager to see what they have to say about the economy and where interest rates might be headed. There’s this thing called the “dot plot” that they’ll release, which basically gives us a sneak peek into their future rate hike plans.
And here’s where it gets exciting: if the dot plot hints at more rate cuts down the road, that could be music to gold investors’ ears. It’s like getting a thumbs-up that gold’s still the go-to guy for protecting your stash against inflation. So, keep an eye on those shiny nuggets, because gold might just be gearing up for its next big move!
Let’s take a look at next week’s standard deviation report and see what short-term trading opportunities we can identify.
GOLD: Weekly Standard Deviation Report
Mar. 16, 2024 11:36 AM ET
Summary
- Gold futures contract shows bullish momentum in the weekly trend, confirmed by closing above the 9-day SMA and VC PMI.
- Potential areas for profit-taking and stop loss levels identified for short and long positions in gold futures.
- Cycle due date on 3.28.24 indicates a potential turning point or significant event in the market. Traders should adjust their strategy accordingly.
gold weekly (tos)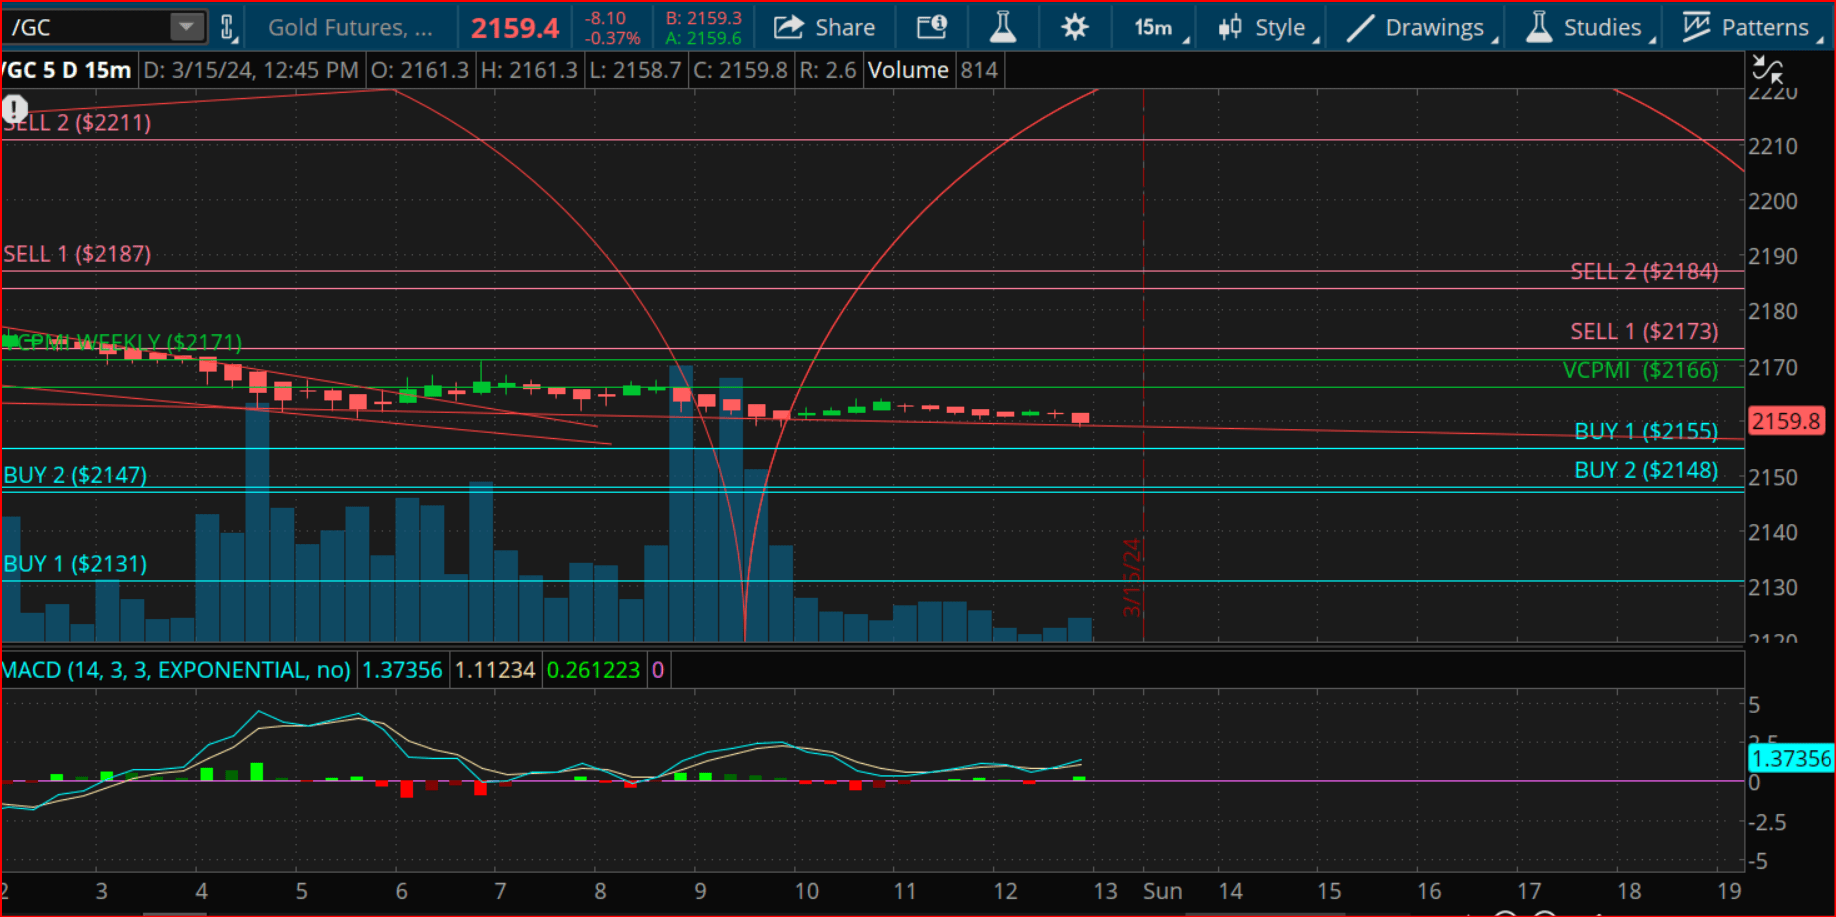
Weekly Trend Momentum: The 9-day Simple Moving Average (SMA) is a widely used technical indicator that helps traders identify the direction of the trend over a short-term period. In this case, with the gold futures contract closing above the 9-day SMA of 2077, it indicates bullish momentum in the weekly trend. Traders often use moving averages as a confirmation tool for trend analysis. When the price is above the SMA, it suggests an uptrend, and when it’s below, it indicates a downtrend. Therefore, closing above the 9 SMA confirms the bullish sentiment for the week. However, it’s important to note that if the price were to close below the 9 SMA, it would invalidate the bullish trend, potentially shifting it to a neutral stance.
Weekly Price Momentum: The Volume-Weighted Average Price (VC PMI) is a trading indicator that shows the average price a security has traded at throughout the day, based on both volume and price. In this case, the VC Weekly Price Momentum Indicator provides insight into the momentum of gold prices over a weekly period. Closing above the VC PMI at 2171 confirms bullish price momentum. This means that the average price at which gold has traded during the week, weighted by volume, is higher than previous weeks, indicating upward momentum in prices. Similar to the trend momentum, if the price were to close below the VC PMI, it would signal a potential shift from bullish to neutral sentiment.
Weekly Price Indicator: The specified levels of 2147-2131 are identified as potential areas for profit-taking for short positions. These levels likely correspond to areas of support or resistance based on previous price action or technical analysis. For long positions, the recommendation is to use the 2131 level as a stop loss, meaning that if the price falls below this level, it would trigger an exit from the long position to limit potential losses. Additionally, taking profits at the levels of 2186-2211 for long positions suggests that these levels are seen as potential areas of resistance, where traders might expect the price to encounter selling pressure.
Cycle: The cycle due date on 3.28.24 indicates a potential turning point or significant event expected in the market around that date. Traders may factor this into their analysis and decision-making process, as such events can influence market dynamics.
Strategy: Based on the analysis provided, the suggested strategy involves capitalizing on the bullish momentum in the gold futures market. For long positions, taking profits in the specified range of 2186-2211 allows traders to lock in gains as the market reaches potentially overbought levels. Monitoring the market closely and adjusting the strategy based on changing conditions, including the upcoming cycle due date, is essential to effectively manage risk and maximize returns.
Overall, the standard deviation report provides a comprehensive overview of the current market dynamics and outlines a strategic approach for trading gold futures, incorporating various technical indicators and price levels to guide decision-making.
Credit: Source link