
• bitcoinBitcoin(BTC)$77,815.001.43%
  • ethereumEthereum(ETH)$2,511.741.29%
  • tetherTether(USDT)$1.000.02%
  • binancecoinBNB(BNB)$719.080.14%
  • rippleXRP(XRP)$1.425.37%
  • usd-coinUSDC(USDC)$1.000.01%
  • solanaSolana(SOL)$102.422.96%
  • tronTRON(TRX)$0.338091-0.15%
  • Figure HelocFigure Heloc(FIGR_HELOC)$1.030.00%
  • zcashZcash(ZEC)$1,154.198.53%
  • HyperliquidHyperliquid(HYPE)$80.113.13%
  • dogecoinDogecoin(DOGE)$0.0835831.16%
  • RainRain(RAIN)$0.014212-6.19%
  • USDSUSDS(USDS)$1.000.02%
  • moneroMonero(XMR)$512.60-0.50%
  • whitebitWhiteBIT Coin(WBT)$80.551.31%
  • chainlinkChainlink(LINK)$11.552.82%
  • leo-tokenLEO Token(LEO)$8.98-0.74%
  • cardanoCardano(ADA)$0.2075331.89%
  • stellarStellar(XLM)$0.1926608.19%
  • Ethena USDeEthena USDe(USDE)$1.000.03%
  • daiDai(DAI)$1.000.01%
  • bitcoin-cashBitcoin Cash(BCH)$222.660.49%
  • USD1USD1(USD1)$1.000.03%
  • uniswapUniswap(UNI)$6.637.47%
  • litecoinLitecoin(LTC)$52.63-2.90%
  • CantonCanton(CC)$0.0958260.03%
  • the-open-networkGram (prev. Toncoin)(GRAM)$1.350.26%
  • hedera-hashgraphHedera(HBAR)$0.0777523.07%
  • avalanche-2Avalanche(AVAX)$7.553.22%
  • Global DollarGlobal Dollar(USDG)$1.000.01%
  • nearNEAR Protocol(NEAR)$2.456.53%
  • shiba-inuShiba Inu(SHIB)$0.0000051.11%
  • suiSui(SUI)$0.722.25%
  • paypal-usdPayPal USD(PYUSD)$1.000.02%
  • crypto-com-chainCronos(CRO)$0.0588922.65%
  • BlackRock USD Institutional Digital Liquidity FundBlackRock USD Institutional Digital Liquidity Fund(BUIDL)$1.000.00%
  • tether-goldTether Gold(XAUT)$4,296.59-0.81%
  • BittensorBittensor(TAO)$231.64-0.19%
  • Circle USYCCircle USYC(USYC)$1.140.01%
  • MemeCoreMemeCore(M)$1.09-2.99%
  • Ripple USDRipple USD(RLUSD)$1.000.01%
  • okbOKB(OKB)$112.44-1.11%
  • Ondo US Dollar YieldOndo US Dollar Yield(USDY)$1.14-0.03%
  • aaveAave(AAVE)$127.962.58%
  • AsterAster(ASTER)$0.701.68%
  • mantleMantle(MNT)$0.572.91%
  • pax-goldPAX Gold(PAXG)$4,299.96-0.81%
  • World Liberty FinancialWorld Liberty Financial(WLFI)$0.0577851.58%
  • Pump.funPump.fun(PUMP)$0.0036784.96%
TradePoint.io
  • Main
  • AI & Technology
  • Stock Charts
  • Market & News
  • Business
  • Finance Tips
  • Trade Tube
  • Blog
  • Shop
No Result
View All Result
TradePoint.io
No Result
View All Result

Dillard’s Stock: Post-COVID Party Is Over, Time To Sell (NYSE:DDS)

March 16, 2024
in Market & News
Reading Time: 4 mins read
A A
Dillard’s Stock: Post-COVID Party Is Over, Time To Sell (NYSE:DDS)
ShareShareShareShareShare

JHVEPhoto/iStock Editorial via Getty Images

YOU MAY ALSO LIKE

Kornacki on what to watch in the NFL season opener

ASE Technology Stock Can Miss August’s Run Rate And Still Beat Q3 Guidance (NYSE:ASX)

If we could only go back in time and buy equity shares of companies that have ridden the right trends and seen their stock skyrocket in the past few years, we’d be so much wealthier today. For example, I wish I had owned names like NVIDIA (NVDA) and… Dillard’s (NYSE:DDS)?!

Shares of the once-struggling US retailer have been up some 120% per year, or about 1,700% cumulatively, since July 2020. At an impressive Sortino ratio (a measure of risk-adjusted performance) of 4.4, DDS has performed much better than NVDA in the post-pandemic era, both in absolute and volatility-adjusted terms, while experiencing far less intense drawdowns than shares of the California-based AI darling (see below).
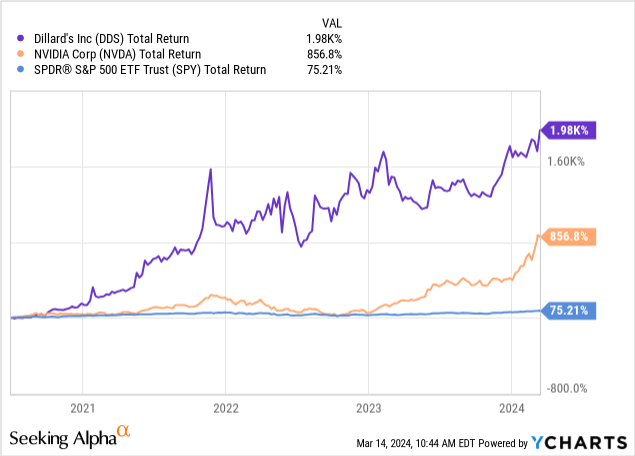
Chart
Data by YCharts

The last time that I published my bearish take on Dillard’s, in August 2019, the company was still fighting all kinds of headwinds: from a slowing global economy to shifting trends towards athleisure and e-commerce. Amid a very unfavorable environment, Dillard’s kept posting dismal results, even more so than peers Macy’s (M) and Nordstrom (JWN) at times. At that point, the COVID-19 crisis had yet to be unleashed onto the world. DDS stock sank 50%-plus within eight months of my article’s publishing date – moments before it began its stratospheric rise from the ashes.

Following one of the most impressive share price rebounds in the retail space, is DDS worth owning today?

Nothing wrong with Dillard’s business

Fundamentally, the retailer seems to be on much better footing than it was last time that I looked at the company’s financial statements.

For starters, Dillard’s balance sheet seems to be quite healthy. Cash and short-term investments of $956 million in the most recent quarter, 20% higher YOY, look great compared to a stable debt balance of only $321 million (excluding small amounts of lease liability). Inventory at $1.1 billion is down 2%, suggesting that Dillard’s has done a decent job at moving merchandise.

The balance sheet has been fed lately by a steady inflow of cash. In 2023, Dillard’s produced over $750 million in free cash flow – a compelling figure, even if down from $828 million in the previous 52-week period. As a result, the retailer was able to deploy a whopping $620 million in cash to shareholders through dividend payments and stock buybacks. This number represents roughly $38 per share per year or 9% of the current market cap.

But the party is likely over

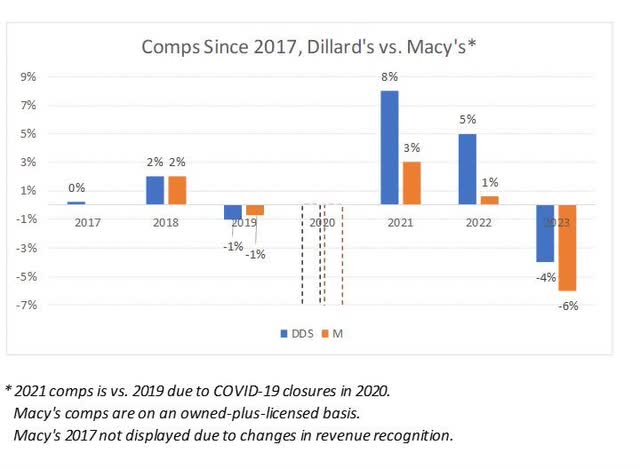
Dillard’s has also been able to shine brighter than some of its peers lately, namely Macy’s. The chart below shows that the Little Rock, Arkansas-based retailer has produced substantially better comps in the post-pandemic recovery period. However, the same graph also helps to illustrate how the good old days of shifting trends away from stay-at-home habits (think 2021 and 2022) may have been left behind.

Comparable Sales Since 2017, Dillard vs. Macy

DM Martins Research

Last year ended up being rough for Dillard’s, with the company having posted comps of -4% (the worst in recent memory outside 2020), and for most of its competitors. In the important holiday quarter, Dillard’s gross margins tanked by 100 bps, while operating expenses increased by 80 bps as a percentage of sales, helping to push pretax income lower YOY by 15%. The dismal results were driven by what the management team has called a “continued challenging sales environment during the fourth quarter”.

Time To Sell DDS

To reiterate, there is nothing particularly wrong with Dillard’s business. The balance sheet remains strong. Cash flow, even if lower YOY in 2023, still looks good for now. And compared to 2019, the retailer seems to be in a much better place, especially now that the COVID-19 headwinds have completely dissipated.
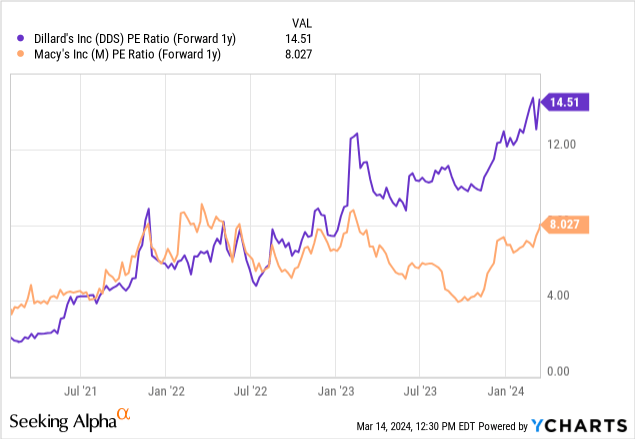
Chart
Data by YCharts

The problem is that the days of pandemic recovery are also in the rearview mirror, most likely. Consensus EPS growth in 2024 and 2025 is projected to be -25% and -9%, respectively. Given unimpressive growth prospects and the volatile nature of the retail space, owning DDS at today’s forward P/E of 14.5x (see above) that is far from de-risked seems like too risky a move, in my opinion.

Credit: Source link

ShareTweetSendSharePin

Related Posts

Kornacki on what to watch in the NFL season opener
Market & News

Kornacki on what to watch in the NFL season opener

September 15, 2026
ASE Technology Stock Can Miss August’s Run Rate And Still Beat Q3 Guidance (NYSE:ASX)
Market & News

ASE Technology Stock Can Miss August’s Run Rate And Still Beat Q3 Guidance (NYSE:ASX)

September 15, 2026
Kornacki: ‘A very tall order’ for Republicans to win New Hampshire Senate seat
Market & News

Kornacki: ‘A very tall order’ for Republicans to win New Hampshire Senate seat

September 15, 2026
Texas Democrat says Republicans ‘know the blue wave is coming’
Market & News

Texas Democrat says Republicans ‘know the blue wave is coming’

September 15, 2026
Next Post
TikTok bans and Airbnb cams

TikTok bans and Airbnb cams

Leave a Reply Cancel reply

Your email address will not be published. Required fields are marked *

Search

No Result
View All Result
The Texas ‘Trumpapalooza,’ and Will AI ‘Kill Us All’ Within A Decade? | Sept. 10

The Texas ‘Trumpapalooza,’ and Will AI ‘Kill Us All’ Within A Decade? | Sept. 10

September 14, 2026
Everybody’s Business: Unpacking Apple’s Upcoming Launches

Everybody’s Business: Unpacking Apple’s Upcoming Launches

September 12, 2026
Columbia Strategic Income Fund Q2 2026 Commentary

Columbia Strategic Income Fund Q2 2026 Commentary

September 14, 2026

About

Learn more

Our Services

Legal

Privacy Policy

Terms of Use

Bloggers

Learn more

Article Links

Contact

Advertise

Ask us anything

©2020- TradePoint.io - All rights reserved!

Tradepoint.io, being just a publishing and technology platform, is not a registered broker-dealer or investment adviser. So we do not provide investment advice. Rather, brokerage services are provided to clients of Tradepoint.io by independent SEC-registered broker-dealers and members of FINRA/SIPC. Every form of investing carries some risk and past performance is not a guarantee of future results. “Tradepoint.io“, “Instant Investing” and “My Trading Tools” are registered trademarks of Apperbuild, LLC.

This website is operated by Apperbuild, LLC. We have no link to any brokerage firm and we do not provide investment advice. Every information and resource we provide is solely for the education of our readers. © 2020 Apperbuild, LLC. All rights reserved.

No Result
View All Result
  • Main
  • AI & Technology
  • Stock Charts
  • Market & News
  • Business
  • Finance Tips
  • Trade Tube
  • Blog
  • Shop

© 2023 - TradePoint.io - All Rights Reserved!