
StevenStarr73/iStock Editorial via Getty Images
BJ’s Wholesale Club (NYSE:BJ) has a medium-sized club model, which seeks to benefit from the stability of the membership income while providing a differentiated proposition in the wholesale landscape.
Investors seeking exposure to the industry turn to BJ’s because of its relatively low valuation compared to the likes of Costco (COST) and Walmart (WMT), but so far, the decision to prefer valuation over quality has led to underperformance.
Let’s see how BJ’s fared in 2023 and assess whether things can change in the future.
Introduction To BJ’s Wholesale
I’ve been covering BJ’s Wholesale Club on Seeking Alpha since May of 2023, maintaining a Hold rating throughout this period.
In my first article, I described the company’s history of lackluster growth, and its counter positioning as a smaller operator. I then showed its results continue to underperform, and explained why I don’t think it can be compared to Costco.
In short, I found that BJ’s doesn’t have the brand power, the differentiated proposition, or an aggressive enough pipeline to drive the same pace of growth as the industry leaders.
Let’s revisit that thesis.
Fourth-Quarter Highlights
BJ’s generated revenues of $5.2 billion in the quarter, up 8.7%, primarily due to the benefit of a 14th operating week in this year’s quarter. On a comparable basis, sales decreased by 0.4% and increased by 0.5% excluding gas.
Gross profit was $963 million, reflecting an 18% gross margin, a 30 bps decline from the prior year period, as higher merchandise costs weren’t fully offset by price increases.
Operating margins remained steady at 4% for seven quarters in a row, leading to an operating profit of $214 million, up 11% Y/Y.
Net income was $274 million, up 12.5% Y/Y, and EPS was $1.1, up 13.4%, reflecting a 90 bps contribution from buybacks.
BJ’s Wholesale Club March 2024 Investor Presentation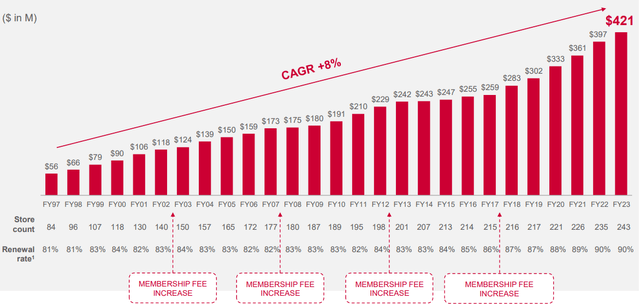
Membership fee income continued to grow at an impressive pace, with member count surpassing 7 million, up 6%. Renewal rates were steady at 90%. Similar to Costco, BJ’s hasn’t increased its membership prices since 2017, and investors will have to wait until a more reasonable timing, namely, more macro uncertainty or lower operating margins.
Created and calculated by the author using data from BJ’s Wholesale Club financial reports (10-K)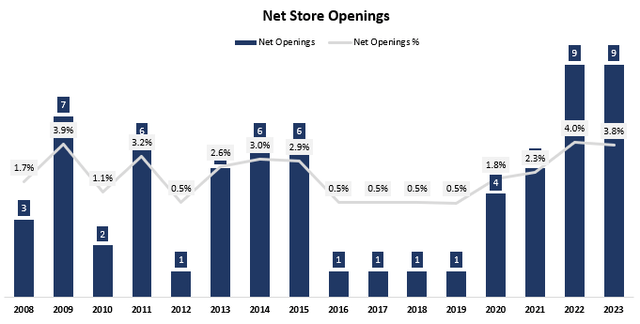
BJ’s opened 9 locations in 2023, similar to 2022, leading to a small deceleration in unit growth, although it stayed in the 4% range.
Overall, BJ’s had another decent quarter, beating EPS estimates and missing on revenues, but without major surprises, good or bad. Let’s see how it fared compared to Costco.
Costco Comparison
In previous articles, I showed the difference in operational stability between BJ’s and Costco, with the latter maintaining margins in a very close range, and the former seeing more fluctuations. Additionally, I said that BJ’s higher margins aren’t necessarily a testament of strength. In fact, I believe the opposite is true.
However, with BJ’s sustaining steady margins for several quarters in a row, I think we can leave the margin analysis out of the equation.
With that in mind, let’s focus on the more important competitive dynamics in calendar 2023 (reminder: Costco’s fiscal year is two quarters ahead of the calendar).
Created and calculated by the author using data from Costco and BJ’s Wholesale financial reports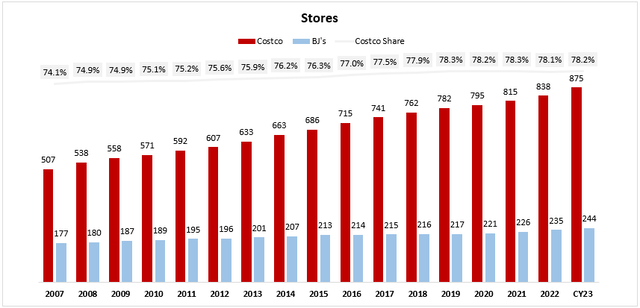
Starting with footprint. As of last quarter, Costco had 875 stores worldwide, compared to BJ’s 244. Once again, Costco grew its locations faster than BJ’s, despite the tougher baseline, with unit growth of 4.4%, compared to BJ’s 3.8%.
Created and calculated by the author using data from Costco and BJ’s Wholesale financial reports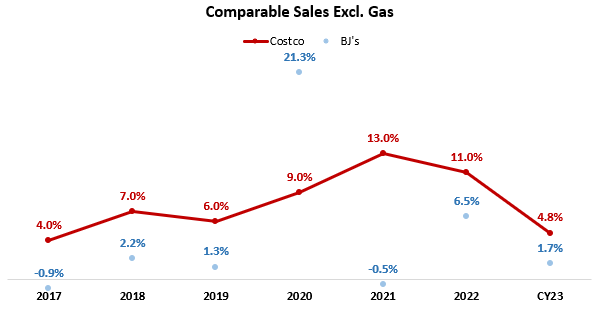
Looking at comparable sales, Costco handily beat BJ’s once again, although the gap narrowed. Notably, Costco’s comparable sales excluding gas in the 17 weeks ended in December grew 5.2%, compared to BJ’s 0.5%, so no sign of improvement on that front for BJ’s.
Created and calculated by the author using data from Costco and BJ’s Wholesale financial reports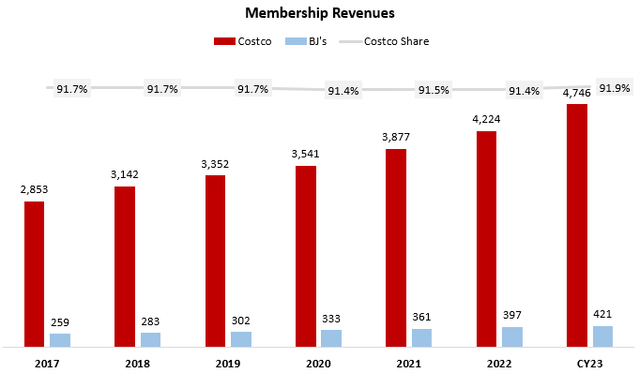
In terms of membership revenues, Costco continues to lead the way, almost reaching 92% of the combined share. Again, if we look at the most relevant calendar period, Costco grew membership fees by 8.2% in the 12 weeks that ended on February 18, 2024, while BJ’s grew by 6.5%.
Created and calculated by the author using data from Costco and BJ’s Wholesale financial reports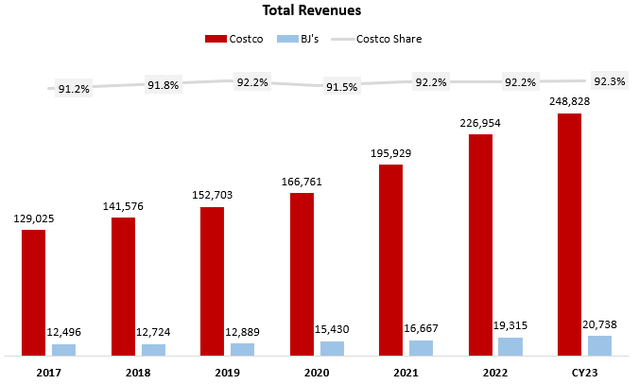
Lastly, if we look at total revenues, Costco gained more share, reaching 92.3% in CY23. In addition, Costco exited the period with faster growth, as it grew total revenues by 5.8% in the 12 weeks that ended on February 18, 2024, whereas BJ’s grew by an underwhelming 1.5% adjusting for the extra week impact.
Overall, I think we can close the seal on another quarter of underperformance from BJ’s against Costco, which leads us to the regular debate.
Value Vs. Quality
While BJ’s business is generally doing ok, the company’s unique business model doesn’t seem to hold against the giants, as the company continues to underperform and lose market share to Costco.
That being said, it remains severely discounted:
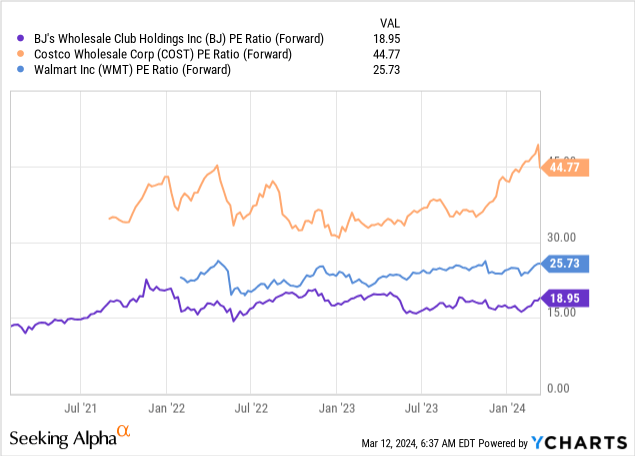
As we can see, Costco is trading at 2.35x times BJ’s multiple, and even Walmart, which doesn’t generate a significant amount of revenue from membership subscriptions, is trading at a 1.35x premium. This is pretty much in line with historical levels.
Looking at growth, BJ’s is expected to grow EPS by 4.2% in 2024 (taking the high end of the company’s guidance and comparing it to 2023 minus the extra week). Costco on the other hand is expected to grow by 12.7%, and Walmart by 6.4%.
This brings us to 4.5x, 3.5x, and 4x PEGs for BJ’s, Costco, and Walmart, respectively (for some reason Walmart’s number in the following graph is incorrect).
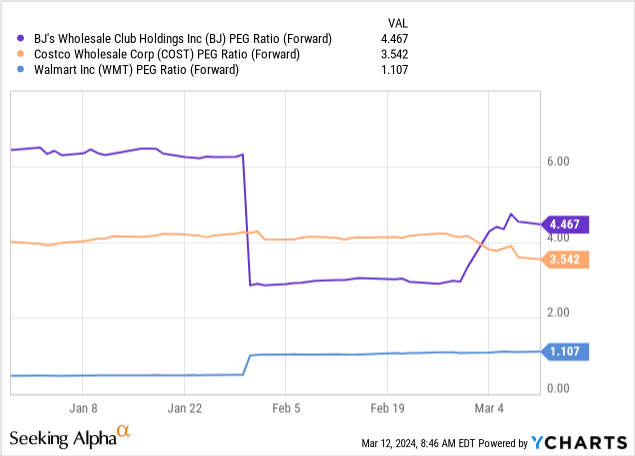
Now, several different conclusions can be drawn from the graphs. A value investor might argue that BJ’s is an attractive alternative, and a quality investor could argue that Costco is worth the premium because of its higher quality.
In my view, as long as BJ’s continues to significantly underperform and lose market share, it won’t produce market-beating returns, regardless of its relatively low valuation. That is very clearly reflected by the company’s highest PEG ratio.
Now that doesn’t go to say Costco is an attractive investment, that’s a topic for a separate article.
Because I don’t expect a material improvement in BJ’s competitive position in the foreseeable future, and because the valuations of the entire group are in the high-end of its range, I still don’t find BJ’s as an attractive investment.
Conclusion
BJ’s Wholesale is a modest club operator, with a decent defensive and resilient business.
Even with its smaller size, the company isn’t able to keep up with the growth of industry leaders, demonstrating the importance of scale, brand, and expansive footprint.
BJ’s relative valuation appeals to some investors, but I find it justified due to its lower quality.
Furthermore, the PEG comparison paints a different picture, that actually shows BJ’s isn’t that cheap on a relative basis. And, at a 19x P/E, BJ’s is overvalued on absolute terms, trading 8% above its historical average.
As such, I reiterate a Hold rating for the stock.
Credit: Source link