

ifish/E+ via Getty Images
Investment Thesis
Semtech Corp. (NASDAQ:SMTC) reported results for its third quarter of FY2024 late last year. Since then, I think the stock has not only bottomed in terms of revenue this quarter and outlook but also in its stock price movement. Semtech stock now provides a more balanced risk-reward after all the negatives have been priced in, and now that the inventory correction causing the downturn should be complete in the first half of the year, according to estimates from Semtech management. I think Semtech stands out from the broader peer group undergoing the correction in that they began to feel the correction earlier and guided down ahead of the peer group, so I believe they will see the recovery earlier as well. Semtech CEO noted on the third quarter’s earnings call, “we were able to secure that capacity and delivered as a result, we shipped it all and saw the correction a little bit early. As a result, we’re seeing the rebound a little bit early.”
Semtech reported its sales down 16% sequentially in Q3 to $200.9M (only slightly ahead of Street expectations of $200M) but up from a year ago quarter at $177.6M. These results come after management guided for a 12-20% drop in sales in the second quarter of FY24. Now, sales for the last quarter of FY24 are expected by management to drop again between 0-10% sequentially, this time to the range of $180-$200M, comfortably lower than consensus expectations of $205.7M. I believe we’re seeing healthier guidance, with a shrink in the sequential drop percentage and better year-over-year growth. I would recommend longer-term investors tune into the stock at the bottom as Semtech’s position in the semi industry is solidified, in my opinion, and I see the stock bouncing back more materially once the industrial correction ends.
Semtech’s Value Proposition
To understand why I think the tides will change in Semtech’s favor, I must first explain the company’s business. Semtech defines itself as a “high-performance semiconductor, IoT systems, and Cloud connectivity service provider.” The company is exposed to three end markets: Infrastructure, high-end consumer, and industrial, with around 60% of the company’s net sales coming from the industrial market, as shown in the chart below from the company’s 10Q report. Infrastructure includes hyperscale and cloud data centers, 5G/4G/LTE base stations, PON/FTTH, Routers and Switches, and Broadband access; high-end consumer encompasses smartphones, tablets, wearables, TVs, PCs, set-top boxes, and white goods. The industrial sector comprises IoT, sensor networks, factory automation, ADAS, UHD Video, and Pro AV.
My positive sentiment on Semtech now, after the pullback, is based on my belief that the company remains extremely well-positioned in the IC business and is arguably better positioned now that the industrial customer inventory correction should be over before the second half of the year. I’ve tracked the industrial and auto-markets’ correction cycle; the inventory correction cycle has weighed on On Semiconductor (ON), Texas Instruments (TXN), and Analog Devices (ADI), to name a few. I think Semtech stands out from the bunch because management has already been pricing in the negatives from the correction since the beginning of FY24. Now, with management from the aforementioned companies estimating the cycle to end in 1H24, I’m more optimistic about Semtech’s potential upside to current expectation numbers.
Semtech 10Q 3Q24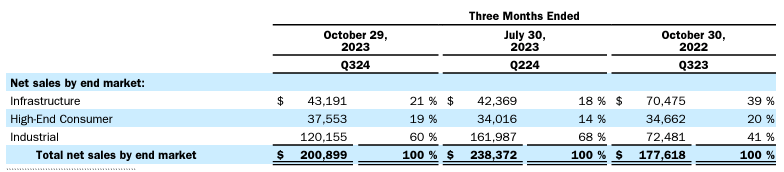
Semtech’s breakdown of net sales by segment also confirms more of the same. Semtech has three main segments: Signal Integrity Group, Protection and Sensing, and IoT systems, as shown in the chart below. The first two recovered slightly sequentially in the third quarter, but IoT system sales, which account for the bulk of revenue, declined 35% sequentially to $77.4M. While investors may take this as a red flag to steer clear of the company, I think it is actually the opposite. Semtech is guiding for the last leg of the correction to impact next quarter, forecasting its Signal Integrity and IoT system sales to be flat to slightly down sequentially due to continued correction in infrastructure and industrial markets, while Protection and Sensing sales are expected to drop sequentially due to seasonality. The near-term outlook remains challenging, but I don’t think this refutes Semtech’s longer-term opportunity in the industry, with an estimated SAM growth of 15% CAGR between FY24 and FY26.
Semtech 10Q 3Q24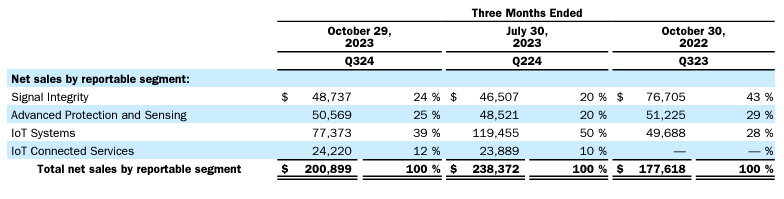
When comparing the six-month chart to the three-month chart, I think we’re seeing the beginning of a turnaround in Semtech stock’s price performance against the S&P 500. Over the past six months, shown in the graph, Semtech stock is down 5% versus the S&P 500, up 15%, which means the stock is underperforming and shows the bottom.
SeekingAlpha – YCharts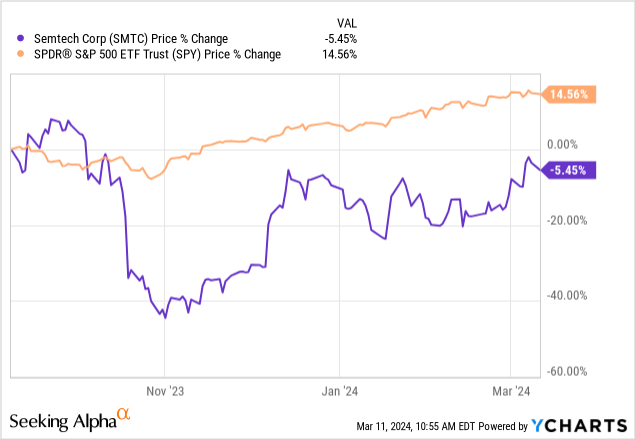
If you switch attention to the three-year chart, Semtech has begun to outperform the S&P 500 recently, as shown in the graph below. I think Semtech will continue to be an in-line performer to slightly outperformer over the next quarter, but expect the stock to rebound more fully back to the early $30s range in the second half of the year on customers replenishing inventory post-correction.
SeekingAlpha – YCharts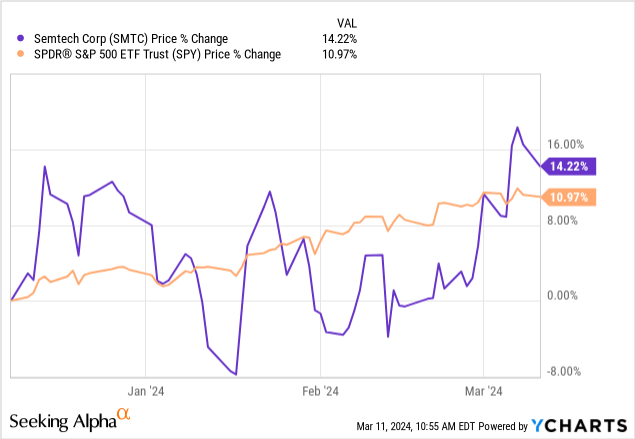
Attractive Valuation
Based on a relative methodology of valuing stocks within my coverage, Semtech provides an attractive opportunity at current levels. Semtech trades at an EV/Sales ratio of 3, lower than the peer group average ratio of 6.9, according to data from Refinitiv shown in the table below. I use the EV/Sales ratio to value Semtech because I believe it’ll better gauge the stock’s current value. Semtech is trading on the higher end of the peer group average on the P/E metric at a ratio of 36.0. I still see a favorable risk-reward profile for the stock as it bounces off the bottom.
Image created by The Techie with data from Refinitiv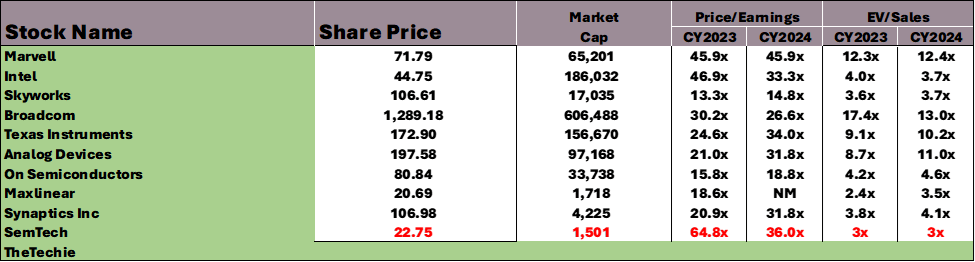
What could go wrong?
The simple answer is a lot more downside. My bullish sentiment is largely based on my belief that Semtech has bottomed out in its stock price and revenue. I don’t think it’s a question of the correction cycle taking longer to complete; instead, the main threat for Semtech alongside the broader semi-peer group is if demand does not pick up post-correction. I maintain my bullish sentiment despite this threat, as I believe the stock at current levels provides an attractive risk-reward scenario for longer-term investors, even if there is more downside ahead in 2H24. Also, worth noting is that Semtech management forecasts share gains in FY25 in the PON space, which is supported by design wins after the company launched the first of its kind 50-gig PON chipset last March. I think that design wins and content gain should help offset weaker end demand post-correction.
What’s Next?
I firmly believe that if the fundamentals are solid, investors should buy where others run and run where others are greedy. Semtech is now under the radar and largely overlooked as the company that got the grunt of the industry downturn last year, down 24% during 2023 and pursued a somewhat contested acquisition of Sierra Wireless amid macro headwinds. I believe expectations for Semtech are low enough that the company is better positioned to comfortably beat them in 1HFY25. Semtech is set to announce earnings in early April; I don’t expect a material outperformance to current consensus numbers for the quarter, but I see more room for upside heading into FY25 than I did heading into FY24 as the longest stretch of the inventory correction is in the past. What I will be watching for mainly this quarter is FY25 guidance, as it’ll be a tell into the demand momentum post-correction. For the coming quarter, in particular, I share a similar expectation as management regarding the impact of the inventory correction cycle on Signal Integrity and the IoT system. Given the stock price drop and current valuation, I see attractive entry points ahead of Semtech’s earning results next month.
Credit: Source link