
jetcityimage
The stock of The Charles Schwab Corporation (NYSE:SCHW) has essentially mimic the performance of the S&P 500 over the last six months. Despite the company’s growth in client assets and active brokerage accounts, its annual financial results were weak. In this analysis, I will explain why the company still retains a HOLD rating by presenting you with opportunities for internal growth, macro challenges, business attractiveness, valuations compared to peers, and where it stands versus its own historical multiples.
Schwab Business
Charles Schwab is a broker with a legacy that has lasted half a decade, and as of today, has a solid business with 34.8 million active brokerage accounts and $8.52 trillion in clients’ assets. Subsequently, 76% of their business comes from what they name investor services, and the rest comes from advisory services. Charles Schwab is in the business of offering services to self-directed customers who place the orders themselves, and also, to those with higher investment capitals that use assistance from a registered investment advisor (RIA) for a maximum fee of 0.8% a year. In addition, they have a bank as part of their subsidiaries, and the company estimates having 12% of the US brokerage retail market share.
In 2020, Schwab conducted not only their biggest acquisition, but the biggest acquisition in the history of the brokerage industry. TD Ameritrade was one of their biggest competitors, and they bought them for the stunning amount of $26 billion. With that, the company was able to aggressively scale their customer base as 12 million client accounts came in. Based on Schwab’s latest earnings report, the integration has been completed for 90% of the accounts, and they expect to finalize the process by May of this same year. Although the integration has taken several years, management stated that they have been receiving positive feedback from customers. It is evident that when you acquire a company of this magnitude, you need to be cautelous with the integration to avoid having many clients transferring their accounts to other brokers. More these days, where there are many incentives to do so.
2023: A Year to Forget
|
2023 |
2022 |
% of total decrease |
|
|
Net Interest |
$9,427k |
$10,682k |
65% |
|
Bank Deposit Account |
$705k |
$1,409k |
37% |
|
Asset Mgmt. & Admin |
$4,756k |
$4,216k |
-28% |
|
Trading |
$3,230k |
$3,673k |
23% |
|
Other |
$719k |
$782k |
3% |
|
Total Revenue |
$18,837k |
$20,762k |
100% |
(Source: Author’s compilations | Data: SCHW Q4 earnings)
Going through the revenues Schwab had for the year, they ended up quite disappointing and weak compared to 2022. Total revenue decreased by $1.9 billion or -9.3% YoY. Then, analyzing their revenue sources, it is evident that what explained most of their decrease is the revenue from net interest income (NNI). During their earnings call, this was probably the most mentioned topic. Not for nothing, it explained 65% of the total decrease, which represent a stand-alone fall of $1.26 billion or -12% YoY. The primary contributor to this revenue loss comes mainly from macroeconomic factors. As customers discover that they can attain historically higher interest rates by transferring their cash to instruments such as money market funds, the company ends up losing cash balances and consequently, NII. Management mentioned that their cash balances decreased by a worrying figure of -30%. Nonetheless, they are confident that the money stayed within Schwab’s as products such as money market funds and CDs experienced high inflows of $200 billion and $225 billion, respectively.
Examinating the revenue table above, the only component that grew was the revenue generated by asset management fees. These fees are directly correlated with the market performance, all else constant, and 2023 was a spectacular year for that, with the S&P 500 rising by 24% on a price return basis.
One particular aspect that caught my attention is, why if the market is rising, trading revenues aren’t increasing as well for Schwab? Isn’t enthusiasm supposed to boost trading activity? Well, their revenues decreased by -12% displaying important signs of weakness. At least for Robinhood (HOOD) and Interactive Brokers (IBKR), trading revenues did increase by 8% and 3%, respectively.
All these challenging environments even led the company to temporarily suspend their share buyback program and to raise $6.2 billion in senior notes.
(Source: Author’s editing | Data: Schwab Trading Activity Index)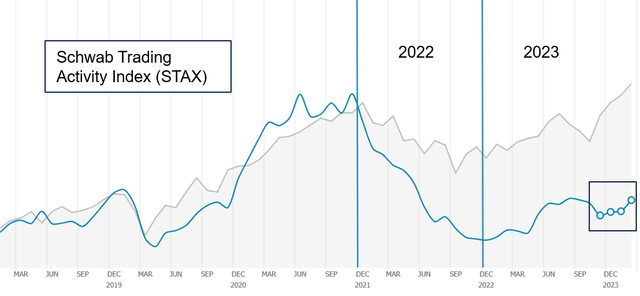
To illustrate even further the trading revenue effect in 2023, we can have a look at the Schwab Trading Activity Index (STAX), which, as its name suggests, it shows the activity that retail investors are encountering on Schwab’s platforms. As you all may know, 2022 was a year of market downside volatility due to emerging factors such as the start of rate hikes, a war in Ukraine, and supply chain constrains, among others. That volatility still obtained high levels of trading activity, even though it began to fade while the year progressed, as displayed on the graph above. On the other hand, 2023 was a year of upside volatility, but certainly not a good year for Schwab. Even though, the before mentioned brokers didn’t grow by double digits, Schwab wasn’t able to capitalize this upward volatility, and again, decreased its trading revenue by -12%. Nonetheless, since November, the STAX has been gradually ramping up with slight movements to the upside as indicated on the graph above as well.
Internal opportunities
When you buy a company such as TD Ameritrade, you not only have the opportunity to take custody of the client’s assets, but also, get the data and the possibility to cross-sell transferred customers. For example, Schwab has proprietary mutual funds and ETFs such as the Schwab U.S. Dividend Equity (SCHD) and the Schwab 1000 Index (SCHK) that could increase inflows from former TD Ameritrade clients to whom these proprietary ETFs were not directly marketed to them before. Other things include the opening of the Schwab Bank Investor Checking account that links a customer to their broker for them to be able to easily manage both cash and investments more conveniently.
There is also the opportunity to integrate former customers of Schwab and TD Ameritrade interchangeably with tools such as Thinkorswim for professional and semi-professional traders, and Thinkpipes or iRebal for investment advisors. I believe both offer excellent capabilities, and this aspect could be a key determinant in choosing a broker.
Now turning the discussing into crypto, Charles Schwab features a section dedicated to the topic. Although they do not offer spot cryptos, they have the Schwab Crypto Thematic proprietary ETF (STCE), which tracks companies with a cryptocurrency focus, such as Coinbase, Block, and Riot Platforms. However, I am curious about why Charles Schwab didn’t launch a proprietary Bitcoin ETF, considering their resources to attract inflows and an already existent section about it on their website.
For example, firms like Vanguard have explicitly outlined the risks and reasons behind their averseness to have clients invest in Bitcoin. However, Schwab, that even offers a crypto ETF, not pursuing a launch of a Bitcoin ETF surprises me. It appears to me like a missed opportunity, especially when their direct competitor, Fidelity, successfully launched the Fidelity Wise Origin Bitcoin ETF (FBTC), which currently holds $7.59 billion in AUM. While a Bitcoin ETF may not dramatically increase management fees as seen in current AUMs of competitors, in the end, it represents additional revenue opportunity.
Valuation
(Source: Author’s compilations | Data: Seeking Alpha)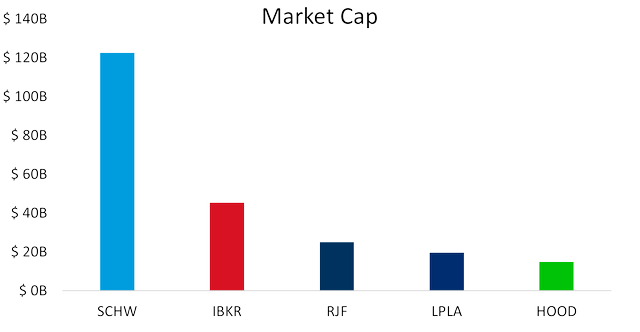
Now let’s examine the valuation and how Charles Schwab trades compared to its peers in terms of multiples. Finding comparable companies for Charles Schwab was relatively straightforward. On this occasion, I included Interactive Brokers Group (IBKR), LPL Financial Holdings (LPLA), Raymond James Financial (RJF), and Robinhood Markets (HOOD). All of them are large cap stocks and derive the majority of their revenues from brokerage services. However, it’s worth mentioning that Schwab has substantially a larger market cap than the rest of the peer group. Although firms like Raymond James and Robinhood have significant differences in types of customers, Charles Schwab competes in both the business of serving clients with RIA and self-directed accounts.
|
SCHW |
IBKR |
RJF |
LPLA |
HOOD |
Median |
Rank |
|
|
P/E GAAP (FWD) |
22.03 |
17.33 |
13.13 |
18.09 |
80.57 |
18.09 |
# 4 |
|
Price to Book (TTM) |
3.86 |
3.22 |
2.34 |
9.48 |
2.21 |
3.22 |
# 4 |
|
Price/Cash Flow (TTM) |
6.26 |
2.54 |
152.27 |
38.34 |
12.59 |
12.59 |
# 2 |
|
PEG Non-GAAP (FWD) |
0.76 |
0.95 |
0.96 |
0.77 |
21.96 |
0.95 |
# 1 |
(Source: Author’s compilations | Data: Seeking Alpha)
At first glance, we can see that Charles Schwab is definitely not showing the most attractive multiples compared to the peer group. However, it’s worth mentioning that it has the lowest forward PEG ratio. Taking that into account, the higher forward P/E doesn’t become a cause for concern, even when trading higher than the median.
Business Attractiveness
|
SCHW |
IBKR |
RJF |
LPLA |
HOOD |
Median |
Rank |
|
|
Revenue Growth (FWD) |
2.5% |
14.0% |
7.1% |
14.0% |
17.5% |
14.0% |
# 5 |
|
Revenue 3 Year (CAGR) |
17.2% |
25.5% |
13.8% |
19.6% |
24.9% |
19.6% |
# 4 |
|
EPS Growth Diluted (FWD) |
4.1% |
15.6% |
10.1% |
19.2% |
— |
12.8% |
# 4 |
|
EPS Diluted 3 Year (CAGR) |
6.2% |
32.8% |
24.9% |
32.7% |
— |
28.8% |
# 4 |
|
TBV 3 Year (CAGR) |
-24.1% |
22.8% |
10.5% |
— |
— |
10.5% |
# 3 |
|
Gross Profit Margin |
96.7% |
90.3% |
93.5% |
30.4% |
83.7% |
90.3% |
# 1 |
|
Net Income Margin |
26.9% |
13.6% |
14.7% |
10.6% |
-29.0% |
13.6% |
# 1 |
|
Return on Equity |
13.1% |
21.9% |
16.8% |
50.2% |
-7.9% |
16.8% |
# 4 |
|
Return on Assets |
1.6% |
4.9% |
2.6% |
14.2% |
-0.2% |
2.6% |
# 4 |
(Source: Author’s compilations | Data: Seeking Alpha)
When comparing the business attractiveness through a ratio analysis, we can observe that Charles Schwab is currently the firm profiting the most from its revenues, displaying an attractive net income margin of 26.9%, which is double than the median. The gross margin is also outstanding, experiencing a current rate of 96.7%. However, when examining forward-looking revenue and EPS growth, the numbers are alarming. The company is only expected to grow its revenues by 2.5%, whereas they have been running them at a CAGR of 17.2% over the last 3 years. Similarly, EPS growth is expected at 4.1%, despite having been running at 6.2%. Of course, that measurement period still takes into account the acquisition of TD Ameritrade, so the historical growth is skewed to the right. Another worrying figure, compared to peers, is the negative tangible book value (TBV) decrease of -24%.
Full disclosure: I didn’t include any leverage or liquidity ratios, such as debt to equity or current ratio, in the valuation since it would be unfair as Charles Schwab has a bank as part of its subsidiaries. Although the bank doesn’t represent the core business of the holding, it dramatically affects the ratios, which fall out of line compared to the other brokers.
Current vs. Historical P/E Multiple
(Source: Author’s compilations | Data: YCharts)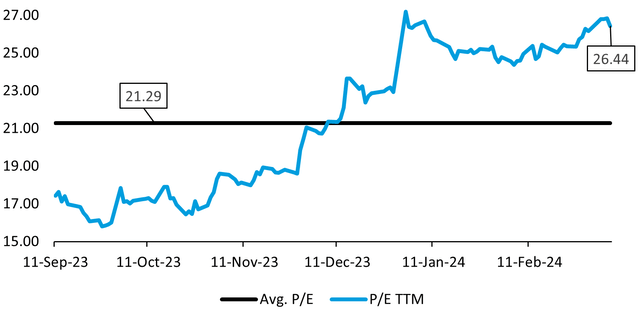
On a standalone basis, the trailing twelve months (TTM) P/E of Schwab is trading 24.2% higher than its historical TTM P/E of the last 6 months. This isn’t necessarily an alarming sign that automatically denotes the stock price as overvalued, but it’s also not a healthy figure to see. For further reference, I calculated the average P/E based on daily prices to minimize the bias of coming up with a stale or smoothed ratio.
Peer Group Stock Performance
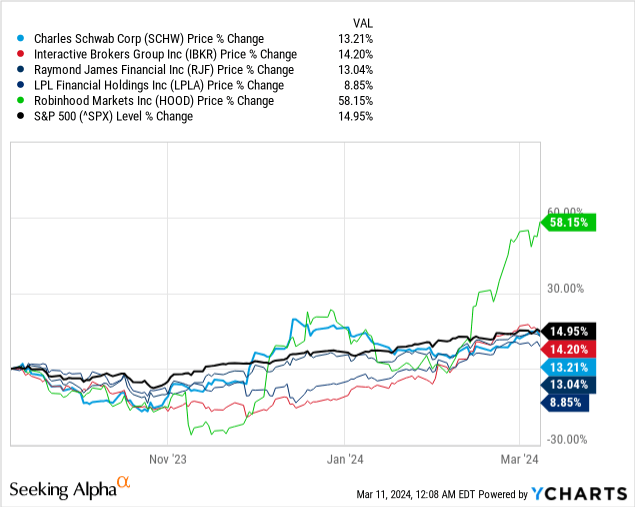
Over the past six months, Charles Schwab and most of its peers have exhibited performances similar to that of the S&P 500 Index (SPX). In most cases, these brokers are highly correlated with stock market activity, so if the broad market trends upwards, it’s likely that the brokers will follow suit. It’s worth mentioning that all the brokers were performing in line with the S&P 500 until February 13th of this year, when Robinhood announced its outstanding Q4 earnings. Since that day, the stock has risen by 43% in less than a month. Perhaps I do an analysis about Robinhood next, so hit the follow button to stay tuned.
Risks
So far, it has been clear that the main driver that is affecting the financial performance is the reallocation of cash from investors. Therefore, it is also clear that what would turn things around is higher reallocations to cash, and this could directly be linked to poor economic outlooks or a unattractable rates. At the beginning of the year, the market was implying seven rate cuts in 2024. Now it’s only three, after positive employment data and an above trend CPI, that has been stagnant in the same range for several months, bringing headwinds to reverse the challenging macro environment.
In my personal opinion, I believe that the sensitivity of investors to shift money back to cash when interest rates decrease would be smaller than when they increased. The reason behind this is that even if the Fed were to decrease rates three or seven times this year, the money market rates would still be attractive compared to pre-pandemic levels.
For instance, Schwab’s largest money market fund (SWVXX), is currently yielding 5.19%. Now assuming that money market rates end up moving in tandem with the current market expectations of three rate cuts, that would make yields decrease to 4.44%. From my point of view, this rate would still remain attractive, posing challenges for Schwab in terms of cash reallocation.
Furthermore, election years typically drive volatility. If this results in higher trading volumes, it would benefit the revenue derived from trading flow, which currently accounts for 17% of the company’s revenue. However, if this positive anticipated event leads to downside volatility, the gains would likely be offset from a decrease in asset management fees as funds lose net asset value (NAV) due to market movements, all else constant. Of course, the ideal scenario for Schwab would be one with upside volatility.
Conclusion
Charles Schwab is currently facing some difficulties that could be solved with an increase of cash deposits to their balances. Fortunately, the company infers that the cash that left remained within Schwab’s money market funds and CDs, but unfortunately the rates are too elevated that the change in yields to the downside has to be substantial for customers to change allocations to cash. On top of that, market expectations of a dovish monetary policy have been reduced by the market inferring three rate cuts instead of seven. Making an even harder outlook for the company in terms of net interest income.
The company lagged behind its peers in terms of trading revenue growth but presents an opportunity to cross-sell old TD Ameritrade customers with proprietary funds and increase revenue from asset management fees. From a valuation perspective, the company doesn’t show attractive multiples against peers, the top-line expectations are quite lower, and from a stand-alone basis, they are trading higher than their average P/E.
Although the company is currently facing some difficulties, and because I know must of you are long-term investors, I personally rate Charles Schwab with a HOLD. The company is mainly being affected by the macroenvironment, and Charles Schwab is a market leader that has all the economies of scale to turn things around when things improve. Even more, when they are providing more value to customers by combining their own technologies with the ones of TD Ameritrade to offer better tools for investors that hardly any other broker can deliver at that scale. Not to mention the networking effects that are obtained with the acquisition and by growing the customer base. They have a solid product with greater margins, than the peer group, and in the end, that’s what would allow them to continue performing in the long term.
Credit: Source link