
slobo
A few months ago, we wrote an article about Costco (NASDAQ:COST). In that piece, we talked about how the combination of the company’s consistent growth, continued buybacks, strong momentum, and reasonable valuation were promising factors that could lead to long-term outperformance for shareholders of the stock.
Fast-forward to today, and it’s certainly been the case so far. Shares are up ~30% from where we issued our buy rating, nearly doubling the performance of the S&P 500 in that time.
However, after moving so quickly in just a few months, the company’s stock may have packed several future years of ‘natural’ appreciation into a very short space of time.
Thus, when combined with a lackluster Q2 earnings report, we’re concerned that the stock may be about to encounter some choppy waters.
Everything we said about our initial thesis in the name remains true to this day. The company is extremely well run and has a number of cost and size advantages that should propel results for decades to come.
However, if you’re not a long-term investor in the name, or have a holding horizon of only a few years, then it might be time to take some profits in the stock.
Today, we’ll take a look at the company’s recent earnings report and resulting valuation picture in order to determine what could happen next with COST. Sound good?
Let’s dive in.
Recent Earnings
First up, let’s take a look at the Q2 earnings report that sent the stock down 7.5% on Friday.
From a top-down perspective, things appear to be ‘all-good’. The company lapped comparable sales estimates for the holiday quarter, topped comp estimates, and beat bottom-line expectations by $0.16 per share.
Additionally, net income margins came in at ~3%, which is the best the company has done in several years. Considering the difficulties that many retailers experienced over the previous ~8 quarters as inflation has run rampant, COST management has navigated the ship well with roughly stable NM% and is now expanding margins as things come back into line. This is great news.
But if earnings were so good, then why did shares sell off?
In short, we think the stock sold off because top-line sales are slowing. Sure, comps were good (and ahead of expectations), but if you zoom out, revenue growth is flat lining:
Seeking Alpha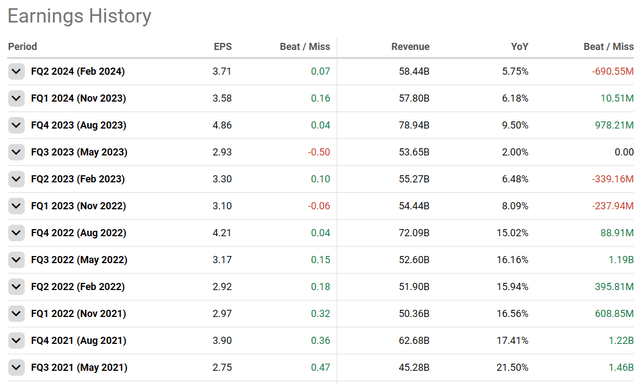
For a company that did so well in years prior, growing top-line results at double-digit (even 20%+!) rates, growth has now firmly come into the mid-single-digits range. This hasn’t impacted margins as we just discussed, but it does indicate that the company will likely have some challenges going forward when it comes to re-accelerating this number.
There are some levers for management to pull, like increasing membership fees or pressing ahead with international expansion, but for the time being, it appears as though COST’s revenue picture is more towards the top end of the S curve:
TradingView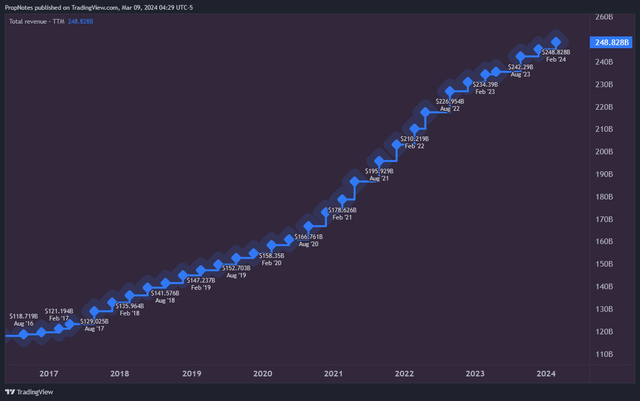
Value
This wouldn’t matter as much if the stock’s valuation wasn’t so demanding.
When we initially pitched the stock last November, the company was trading at a 0.98x sales multiple, and a ~39x bottom-line valuation:
TradingView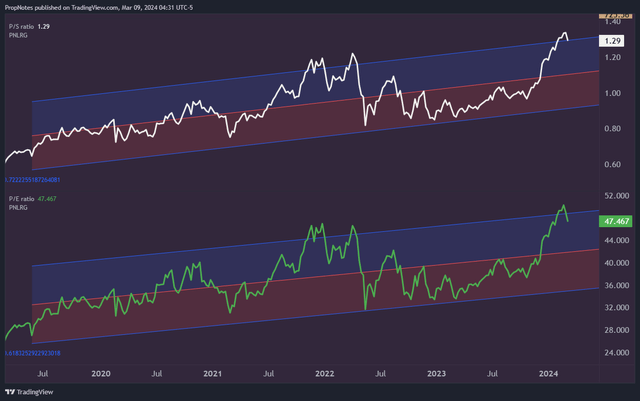
However, now, with two more quarters of information to work off of, it’s clear that the majority of the appreciation that the stock has enjoyed in the last 4 months has been largely due to the expanding multiple.
You can see this above, as the stock’s top and bottom-line valuation has extended above a standard deviation of a 5-year linear regression.
This doesn’t mean that the multiple can’t continue expanding, but when combined with the revenue picture, it does indicate that risk in the stock is firmly to the downside.
Looking ahead, COST appears very expensive.
When baking in historical multiples, growth, and model multiples for that growth, we get a Fair Value range for COST stock somewhere between $415 and $510 per share:
PropNotes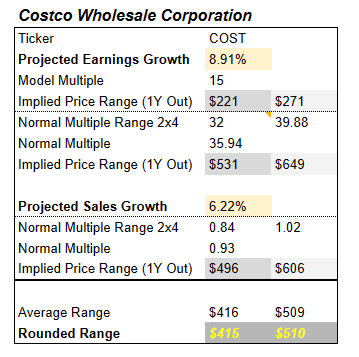
To us, ‘Fair Value’ is simply the price at which an investor can expect to participate fully in the business going forward.
In November, we liked the stock at $550, which was only a bit above our estimates of ‘Fair Value’. This wasn’t a concern, especially if someone was looking to invest in a quality business for the long term.
However, now, at $725 per share even after a 7% drop, the stock is still the most richly valued consumer staples (XLP) stock out of all of the ones we cover:
PropNotes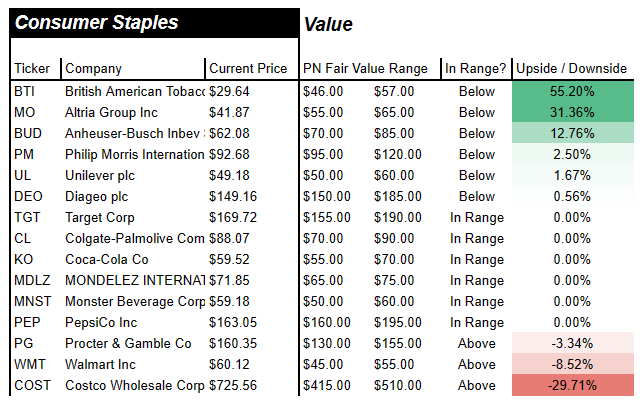
This is concerning because it means that while the company may well continue to produce consistent results going forward, if the multiple begins to mean-revert lower as we expect could happen, the stock could still suffer from a downturn, or at least a prolonged period of chop.
If you look at where the stock is trading now, and extend out COST’s 5-year historical AOE multiple, then shares are about 4 years ‘ahead’ of the results of the business:
FAST Graphs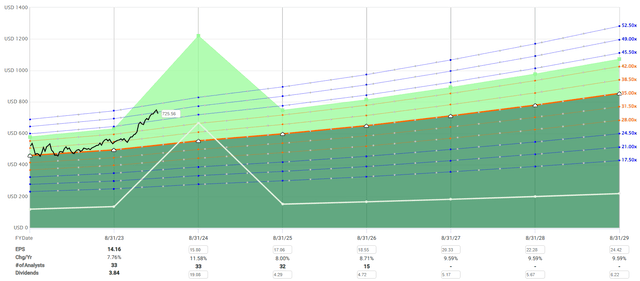
This indicates that if your holding period is any shorter than 4-5 years, right now might be a very good time to take profits in the name. At the very least, we expect that you’ll be able to buy back in at a lower price sometime between now and 2028.
Risks
There are some risks to this thesis. For example, it’s possible that the market is correct, and the long-term multiple of COST deserves to be considerably higher than both its growth rate modeling would suggest, as well as higher than the already-rich valuation the stock has traded at recently.
This could be due to an under-counting of future growth that comes from international expansion, or margin improvements that could come from better management execution and planning.
However, it appears more likely that greed and exuberance have engulfed investors in this name and now is a good time to consider pulling up stakes in short and medium-term positions.
Summary
All in all, our long-term thesis about Costco remains true. This company is a gem and certainly appears to be a great long-term hold.
That said, for short- or medium-term investors sitting on big gains in positions, or for those who may need the capital for other things in coming years, then cashing out now or trimming seems like the best course of action. Taking advantage of exuberant pricing appears like the best risk/reward thing to do.
Thus, we downgrade COST to a ‘Hold’. When things improve, we look forward to upgrading the stock again, but it’s simply not there at the present moment.
Good luck out there!
Credit: Source link