
Sundry Photography
In our previous coverage of Analog Devices, Inc. (NASDAQ:ADI), we examined the attributes of Maxim acquisition to ADI’s exceptional growth (64.2%) in 2022. Firstly, we expected ADI’s analog market share to reach 17.2% in 2022, tying Texas Instruments for the highest in the industry. Secondly, we determined Maxim’s impact in ADI’s automotive segment, which drove over 100% growth in its automotive BMS portfolio. In addition, we calculated that Maxim was directly responsible for 41.7% of ADI’s growth in 2022, while the remaining 22.5% was ascribed to organic expansion. Lastly, we expected Maxim to continue driving ADI’s revenue growth through a higher proportion of product releases.
In this analysis of Analog Devices, we examine the company’s growth prospects beyond 2024, given the slowdown that occurred throughout 2023. We previously forecasted ADI’s 2023 revenue to grow by 10.4%, yet the actual result was only 2.4%. Additionally, its latest Q1 2024 results showed its growth declining by 22.7% YoY. Firstly, we analyze the slowdown in all segments and determine the reason for its slowing performance. Next, we identify ADI’s key segments, including Automotive and Industrial and examined its growth outlook based on its strategic initiatives to identify how ADI can capitalize on the market drivers to improve its future outlook.
Revenue Slowdown Across All Segments
|
Yearly Revenue by Segment ($ mln) (CY) |
2019 |
2020 |
2021 |
2022 |
2023 |
Average |
|
Industrial |
3,004 |
3,006 |
4,027 |
6,069 |
6,555 |
|
|
Growth % (YoY) |
-4.0% |
0.1% |
34.0% |
50.7% |
8.0% |
17.7% |
|
Automotive |
933 |
779 |
1,248 |
2,516 |
2,915 |
|
|
Growth % (YoY) |
-7.6% |
-16.5% |
60.3% |
101.5% |
15.9% |
30.7% |
|
Communications |
1,284 |
1,194 |
1,207 |
1,881 |
1,620 |
|
|
Growth % (YoY) |
11.5% |
-7.0% |
1.1% |
55.8% |
-13.9% |
9.5% |
|
Consumer |
770 |
625 |
836 |
1,548 |
1,216 |
|
|
Growth % (YoY) |
-17.6% |
-18.8% |
33.8% |
85.1% |
-21.5% |
12.2% |
|
Total Revenue |
5,991 |
5,603 |
7,318 |
12,014 |
12,306 |
|
|
Growth % (YoY) |
-3.8% |
-6.5% |
30.6% |
64.2% |
2.4% |
17.4% |
Source: Company Data, Khaveen Investments
From the table above, Analog’s revenue growth was flattish (2.4%), which is significantly lower than the average growth of 17.4%. Only two segments had positive growth, which were Automotive (15.9%) and Industrial (8.0%). Nevertheless, all segments experienced a slowdown in revenue compared to the past two years. As we previously analyzed, its growth in 2021 and 2022 was boosted by its Maxim acquisition (41.7% of revenue). However, even without the boost, ADI’s organic growth in 2021 and 2022 remained strong at 20.6% and 32.6%, respectively. As we further examined its quarterly revenue performance, its slowdown is seen worsening.
|
Quarterly Revenue by Segment ($ mln) (FY) |
Q1 2023 |
Q2 2023 |
Q3 2023 |
Q4 2023 |
Q1 2024 |
|
Industrial |
1,690 |
1,745 |
1,629 |
1,491 |
1,197 |
|
Growth % (YoY) |
26.1% |
16.1% |
4.0% |
-10.1% |
-29.2% |
|
Automotive |
718 |
785 |
748 |
665 |
739 |
|
Growth % (YoY) |
28.8% |
23.9% |
15.3% |
-1.7% |
2.9% |
|
Communications |
488 |
454 |
381 |
297 |
303 |
|
Growth % (YoY) |
18.2% |
-4.5% |
-22.6% |
-40.7% |
-38.0% |
|
Consumer |
353 |
280 |
319 |
263 |
274 |
|
Growth % (YoY) |
-5.4% |
-22.5% |
-20.8% |
-35.9% |
-22.4% |
|
Total Revenue |
3,250 |
3,263 |
3,076 |
2,716 |
2,513 |
|
Growth % (YoY) |
21.1% |
9.8% |
-1.1% |
-16.4% |
-22.7% |
Source: Company Data, Khaveen Investments
As seen in the quarterly revenue breakdown, the performance in all segments declined QoQ, and it was negative in Q4 across all four segments, dragging the company’s growth down to -16.4%. In Q1 2024, the company’s revenue growth worsened to -22.7% YoY as the Industrial segment slowed down. On the other hand, the Automotive segment improved in Q1 with positive growth. Management previously highlighted the segment benefitting strong growth in “functionally safe power, battery management and in-cabin connectivity solutions”. Furthermore, management highlighted the negative results in the Communications and Consumer segments were driven by “industry weaker demand and ongoing inventory corrections”. Furthermore, management highlighted in its latest earnings briefing that it faced macroeconomic headwinds as the “macro situation remains challenging” and had previously cited the Chinese semicon market weakness.
Thus, we determined possible factors for the company’s slowing growth including macroeconomic weakness, customer inventory digestion and China market weakness. Firstly, we examined the GDP growth rate in 2023 to determine whether macroeconomic weakness was a factor.
|
GDP Growth Forecast |
Initial 2023 (Q1 2023) |
Latest Revised 2023 (Q4 2023) |
Latest 2024 (Q1 2024) |
|
IMF |
2.90% |
3.00% |
3.10% |
|
PwC |
1.60% |
2.70% |
2.30% |
|
EY |
1.40% |
3.00% |
2.80% |
|
World Bank |
1.70% |
2.60% |
2.40% |
|
Average |
1.90% |
2.83% |
2.65% |
Source: IMF, PwC, EY, World Bank, Khaveen Investments
The revised GDP growth for 2023 (2.83%) exceeds the initial Q1 growth (1.9%), indicating stronger growth expectations. Furthermore, the average GDP growth outlook for 2024 appears stable with an average of 2.65%. Therefore, we believe ADI’s growth slowdown was not primarily due to the macroeconomic weakness factor.
|
Top 5 Analog Company’s China Revenue ($ mln) |
2022 |
2023 |
Growth (%) |
|
Analog Devices |
2,564 |
2,230 |
-13.0% |
|
NXP (NXPI) |
4,700 |
4,171 |
-11.3% |
|
STMicro (Asia Pacific) (STM) |
10,199 |
9,516 |
-6.7% |
|
Infineon (OTCQX:IFNNF) |
4,063 |
4,124 |
1.5% |
|
Texas Instruments (TXN) |
9,874 |
7,375 |
-25.3% |
|
Average Growth (%) |
-11.0% |
Source: Company Data, Khaveen Investments
In addition, we analyzed the top analog companies’ China market revenue growth in 2023 to determine whether there had been a slowdown in China as claimed by management. From the table above, the top analog chipmakers’ average revenue growth rate was negative (-11%) compared to 2022. We identified that China’s imported IC chips declined by 10.8% by volume in 2023 compared to the 2022 level, as mainly reflected by China’s weak smartphone and laptop sales resulting from China’s economic headwinds.
Furthermore, in terms of “inventory digestion” issues across all four segments, as brought up by the company, we believe the automotive market production levels that exceeded sales in the past 2 years could highlight high automaker inventory levels. Moreover, Intel Mobileye (INTC) also highlighted its Tier 1 automakers were facing excess inventory build-up since the supply crunch in 2022, thus we believe had an impact on ADI’s Automotive segment growth.
Regarding the Industrial segment, we examined the Industrial Production Growth in the chart below. As seen, Industrial Production growth has been on a downward trend since 2022, indicating a slowing down in production globally. Moreover, the US growth was seen as negative in October last year. Hence, we believe the slowdown in ADI’s Industrial segment was affected by the slowing industrial activity.
Federal Reserve Bank of Dallas, Khaveen Investments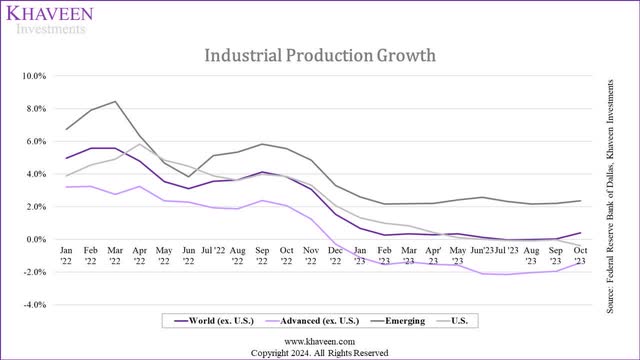
On the other hand, in the PC and smartphone segments, the markets have been improving with recovering growth through 2023. According to Canalys’s research, in Q4 2023 the global smartphone market growth increased 8% YoY, suggesting a recovery and stabilization signs.
In summary, we reviewed market trends across all four segments and believe that ADI’s negative growth may not be attributed solely to macroeconomic headwinds but to customer inventory issues, especially in the Automotive and Industrial segments. Also, we believe ADI was also impacted due to the China market weakness as smartphone and PC markets slowed down, leading to lower demand for chips. Notwithstanding, the Chinese PC market is forecasted to stabilize and recover throughout 2024 with a growth rate of 4% according to Canalys, which is in line with our expectations for the global PC market to recover in 2024 (11.5%). That said, we see the smartphone market remaining flattish (-0.1%) in 2024 in China as consumers hold on to their current phones rather than upgrading. Additionally, regarding industrial production, global production growth is expected to pick up in H2 2024 following the slowdown, which we believe bodes well for its Industrial segment growth recovery whereas the automotive market chip inventory levels could stabilize this year as automakers had cut orders since last year.
Automotive Segment as Key Growth Segment
While ADI’s growth has been slowing down across the quarters, we believe the Automotive segment remains promising as the highest-growing segment with a 15.9% growth in 2023 and accounted for 23.7% of ADI’s revenue.
ADI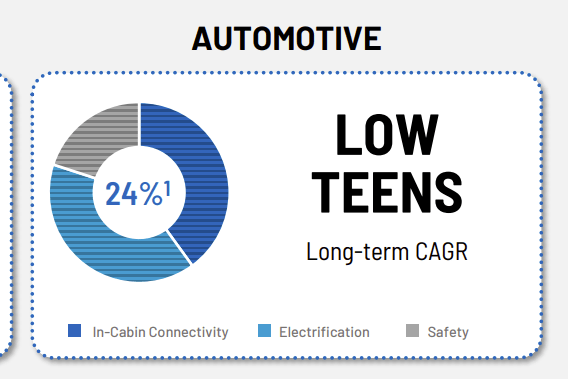
Based on its previous 2023 Investor Presentation, In-Cabin Connectivity and Electrification each contribute about 40% of the revenue and Safety accounted for (around 20%). In addition, the company highlighted demand for EVs (BMS), Autonomous Vehicles (GMSL, FuSa Power), and In-cabin experience (A2B, Active Noise Cancellation) drove ADI’s Automotive segment growth with around 50% of its revenue in 2023 attributed to these drivers. Thus, we examine whether ADI can continue to capitalize on these drivers to sustain growth.
Battery Management System (BMS)
BMS monitors and manages battery strings in EVs to ensure safety. According to Yole, the global BMS market is projected to have a 15.6% CAGR driven by strong demand for EV batteries.
|
ADI’s BMS |
2022 |
2023 |
Growth (%) |
|
ADI BMS-Related Total Shipments (mln) |
10 |
20 |
100% |
|
Total Global EVs On the Road (mln) |
29 |
43.2 |
49.0% |
|
BMS for EVs Market Share |
34.5% |
46.3% |
Source: Company Data, ICCT, EV Volumes, Khaveen Investments
We compiled ADI BMS-Related Total Shipments to date from ADI’s Investor Presentations and compared them with total global EVs to determine ADI’s share in the BMS for EVs market. As seen above, ADI’s shipment growth was double the total EVs growth, resulting in an increase in BMS’ market share to 46.4%, highlighting ADI’s strong leadership in the BMS for EVs market.
ADI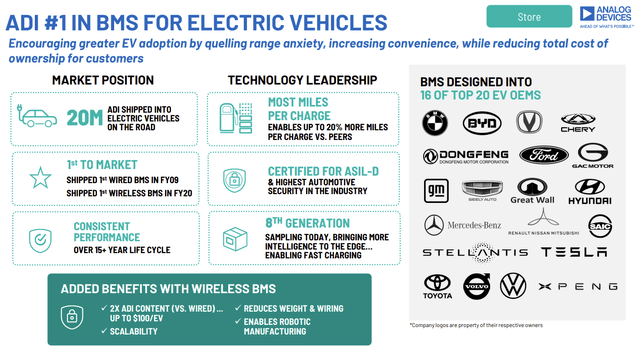
Furthermore, the company was also the first to launch Wireless BMS (wBMS) for EVs, offering additional features that revolutionize EV production. According to the company, wBMS could increase ADI’s content up to 2x higher compared to wired BMS. Given the low cost of ownership and cybersecurity certification, we believe that ADI could secure new customers with its wBMS. Moreover, ADI recently collaborated with Rohde & Schwarz to advance the wBMS adoption in the automotive industry. Thus, we expect ADI to continue leading the BMS market with its continuous innovation.
In-Cabin Connectivity Solutions
Another key driver is the in-cabin connectivity solutions, specifically the incorporation of Gigabit Multimedia Serial Link (GMSL) technologies. GMSL was originally developed by Maxim, which assists power supply, control, fault reporting, and video transmission within vehicles, and is now being deployed in the ADAS system. Currently, the third generation of GMSL can handle up to 12 Gbps and has been adopted by 25 OEMs for various applications. However, ADI’s competitor, Texas Instruments, also has its FPD-Link IV with a speed up to 13.5 Gbps. Thus, we are unable to determine if ADI’s GMSL has a competitive edge over TI’s FPD-Link.
Outlook
|
Revenue Projection by Segment ($ mln) (CY) |
2023 |
2024F |
2025F |
2026F |
|
Automotive |
2,915 |
3,221 |
3,638 |
4,109 |
|
Growth % (YoY) |
15.9% |
10.5% |
13.0% |
13.0% |
Source: Yole Group, MarketsandMarkets, Khaveen Investments
Overall, we believe the company’s Automotive segment growth to be supported by its BMS and GMSL technologies driven by EV growth as well as vehicle connectivity. According to Yole, 90% of vehicles will be connected by 2028, and more than 60% of global car sales in 2030 will be attributable to EVs. The global BMS market and in-vehicle connectivity market has a forecast CAGR of 15.6% and 16% respectively, higher than the automotive semicon market CAGR of 10.1%. We derived a weighted average CAGR for ADI as 50% of its revenues are related to products including BMS and GMSL and the remaining 50% on the automotive semicon market CAGR, for a total weighted CAGR of 13%. In 2024, we based our forecast on its actual Q1 revenues and Q2 onwards on our weighted CAGR of 13%. As such, we see its growth improving beyond 2024, lower than 2023 but in line with management’s long-term target of “low teens growth” from its Investor Presentation.
Industrial Segment Expected to Return to Growth
Besides Automotive, we identify that the company is also focusing on its Industrial Segment, as management previously stated that it increased its “focus in this market and invested over $5 billion in R&D activities to capture the opportunity across the hundreds of applications that characterize the industrial sub-segment”.
ADI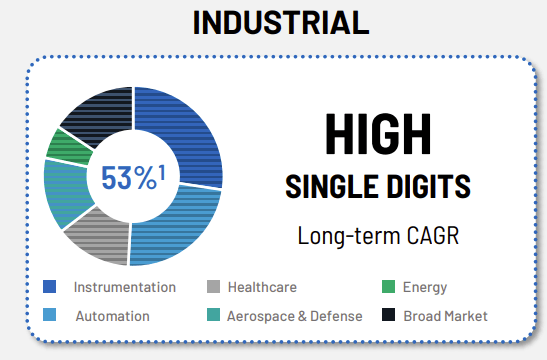
Based on its Investor Presentation, Instrumentation and Automation contribute over 50% of the industrial segment’s revenue. However, the company highlighted that the segment growth in 2023 was mainly driven by healthcare, sustainable energy and aerospace & defense (A&D).
Source: Statista Market Insights, The Insight Partners, Allied Market Research, Khaveen Investments
We complied market CAGR for each of ADI’s Industrial Sub-Segments. Based on the company’s business description, we derived the market CAGR for the Instrumentation sub-segment as the market CAGR of the Electronic Products and Components subindustry, which is 2.58%. Similarly, the Automation sub-segment market CAGR was derived from the Industrial Automation Market CAGR of 8.2%. In addition, the Healthcare sub-segment market CAGR (5.7%) was taken from our previous analysis of IHI, Aerospace & Defense CAGR (7.6%) from our previous analysis of MACOM (MTSI), and Energy Management CAGR (10.5%) from our previous analysis of TAN (TAN). For Broad Markets, we based our forecast on the overall semicon industry forecast CAGR of 8.7%.
As seen in the table, the top 3 sub-segments with the highest CAGR are Energy Management, Aerospace & Defense, and Automation. This also aligns with ADI’s management report in the earnings briefings as mentioned above. We calculated the average market CAGR for the Industrial segment to be 6.92% and analyzed the drivers of each sub-segment below.
Energy Management
The Energy Management subsegment has the highest CAGR (10.5%) among all, driven by strong growth in renewable energy deployments, specifically the deployment of smart grid technology, which efficiently collects and manages energy data. Hence, despite the Energy sub-segment’s smaller revenue contribution, we believe smart grid deployments will drive the growth in this sub-segment.
Aerospace & Defense
We believe that increased spending, equipment upgrades, and modernization demands are its key drivers, as highlighted in our Macom analysis. The global increase in defense spending in AI and advanced technology also highlights growth potential. We have compiled the number of addressed applications in A&D industry from ADI and its competitors and determined that ADI has the most applications. Therefore, we expect ADI to continue its leadership in providing A&D solutions.
|
Aerospace & Defense Application |
Analog Devices |
Texas Instruments |
STMicro |
NXP |
Infineon |
|
Number of Applications |
10 |
5 |
2 |
7 |
2 |
Source: Company Data, Khaveen Investments
Automation
The company mentioned that the digitalization of factories is driving the automation sub-segment as its “customers are upgrading their factories with more automation and connectivity to increase output with greater energy efficiency”.
Moreover, ADI mentioned that it has leveraged its I/O-Link products to provide solutions for the customer, resulting in “3x the bill of materials and secured design wins across their entire platform”. In addition, the company highlighted that gigafactories as positive growth drivers with more than 190 new gigafactories planned globally. Therefore, we expect ADI to capitalize on these growths while providing its innovative and broad product portfolio to these customers.
ADI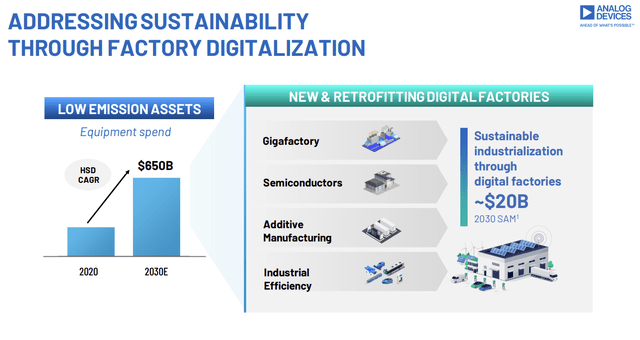
Medical Devices
We believe the Medical Devices market is driven by demand for innovative products and advanced medical technologies, and ADI’s Healthcare subsegment growth is driven by Maxim’s comprehensive solutions. This subsegment generates around $900 mln annually for ADI, representing 14% of ADI’s Industrial revenue. Additionally, the company has recently won Best of Sensors for its Health Sensor Platform 4.0, indicating its high-quality product portfolio. Thus, we believe this sub-segment remains a strong growth driver of ADI.
Instrumentation
The Instrumentation contributes about 23% of ADI’s Industrial Segment revenue despite its low CAGR. According to ADI’s CEO, its growth outlook is driven by “connectivity to AI-assisted compute to electrification to drug discovery and gene therapies”. Also, ADI claimed that its advanced metrology and test have resulted in an increase in its average content per system by 2-3x higher. Thus, we expect ADI to continue to capitalize on these drivers.
Market Share
Finally, we examine ADI’s Industrial segment revenue with that of the leading analog industrial semicon companies below.
|
Company’s Industrial Segment Revenue ($ mln) |
2022 |
2023 |
Growth (%) |
|
Analog Devices |
6,069 |
6,555 |
8.0% |
|
NXP |
2,713 |
2,252 |
-17.0% |
|
STMicro |
4,999 |
5,172 |
3.4% |
|
Infineon |
1,790 |
2,205 |
23.2% |
|
Texas Instruments |
8,011 |
7,008 |
-12.5% |
|
Total |
23,583 |
23,192 |
1.0% |
Source: Company Data, Khaveen Investments
We observed that the total industrial segment revenue growth in 2023 was flattish, showing only 1% growth. However, we saw positive growth for ADI, STMicro and Infineon. Specifically, ADI’s revenue growth led to second place with 8%, indicating a stronger performance compared to the market, helping the company gain more market share in 2023 (25.7% to 28.3).
Company Data, Khaveen Investments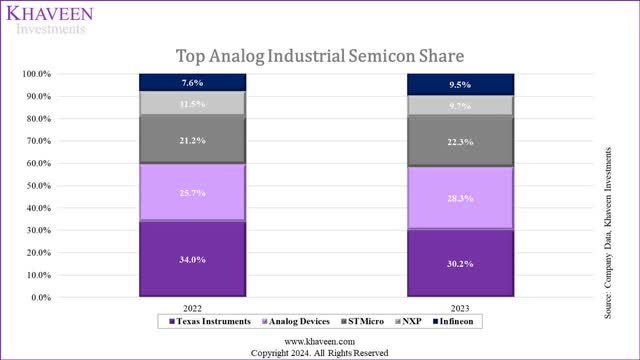
Outlook
|
Revenue Projection by Segment ($ mln) (CY) |
2023 |
2024F |
2025F |
2026F |
|
Industrial |
6,555 |
6,081 |
6,520 |
6,990 |
|
Growth % (YoY) |
8.0% |
-7.2% |
7.2% |
7.2% |
Source: Company Data, Khaveen Investments
Overall, we identified several strong drivers for ADI’s Industrial segment, including renewables, factory automation and Aerospace & Defense, which has the highest CAGR among its Industrial subcategories. Capitalizing on these drivers, we believe ADI could continue strengthening its market share position in the Industrial semicon market. We forecasted its Industrial segment’s long-term growth based on our derived average of 7.2%. However, in 2024, we projected its revenue based on its actual Q1 results and Q2 based on its past 3 quarters’ average growth (-11.8% YoY), before recovering in Q3 onwards based on our long-term average of 7.2%, as we expect the Industrial segment to recover in the second half of the year as production activity is expected to pick up. Thus, we expect its Industrial segment to contract in 2024 before recovering in 2025 in line with management’s long-term growth target of “high single digits” based on its Investor Presentation.
Risk: Increasing Days Inventory Outstanding
|
Efficiency Analysis |
2014 |
2015 |
2016 |
2017 |
2018 |
2019 |
2020 |
2021 |
2022 |
2023 |
TTM |
|
Inventory Turnover |
4.85x |
2.44x |
2.50x |
2.45x |
2.07x |
1.95x |
1.81x |
1.53x |
1.47x |
1.40x |
1.30x |
|
Days Inventory Outstanding (days) |
75 |
149 |
146 |
149 |
177 |
187 |
202 |
238 |
248 |
260 |
281 |
Source: Khaveen Investments
We had previously discussed about the company’s days inventory outstanding issue which has deteriorated to 281 days (TTM) with a turnover ratio decreasing to 1.30x, indicating the company’s inventory build-up as its growth slowed down due to the factors explained above of inventory issues in Automotive and Industrial segments and China growth headwinds. However, we expect its inventory situation to gradually improve beyond 2024 as we see its growth recovering, driven by its Automotive segment.
Verdict
|
Revenue Projection by Segment ($ mln) (CY) |
2023 |
2024F |
2025F |
2026F |
|
Industrial |
6,555 |
6,081 |
6,520 |
6,990 |
|
Growth % (YoY) |
8.0% |
-7.2% |
7.2% |
7.2% |
|
Automotive |
2,915 |
3,221 |
3,638 |
4,109 |
|
Growth % (YoY) |
15.9% |
10.5% |
13.0% |
13.0% |
|
Communications |
1,620 |
1,514 |
1,621 |
1,735 |
|
Growth % (YoY) |
-13.9% |
-6.51% |
7.1% |
7.1% |
|
Consumer |
1,216 |
1,183 |
1,247 |
1,315 |
|
Growth % (YoY) |
-21.5% |
-2.67% |
5.4% |
5.4% |
|
Total Revenue |
12,306 |
11,999 |
13,026 |
14,149 |
|
Growth % (YoY) |
2.4% |
-2.49% |
8.56% |
8.62% |
Source: Khaveen Investments
Overall, we projected the company’s revenue growth by segment in the table above with the Industrial and Automotive segments’ growth beyond 2024 based on our derived weighted CAGR. For its Consumer and Communications segments, we based it on its past 5-year historical CAGR. As seen, we forecasted its growth to contract in 2023 by 2.5%, which represents a more optimistic forecast compared to analyst revenue estimates (-25.78%) as we see the company’s growth recovering throughout the year, especially in the second half as automotive inventories stabilize and global industrial activity is expected to pick up. Beyond 2024, we see ADI returning to positive growth of 8.6% in 2025, which is also in line with the company’s expected long-term CAGR of 7 to 10%.
Khaveen Investments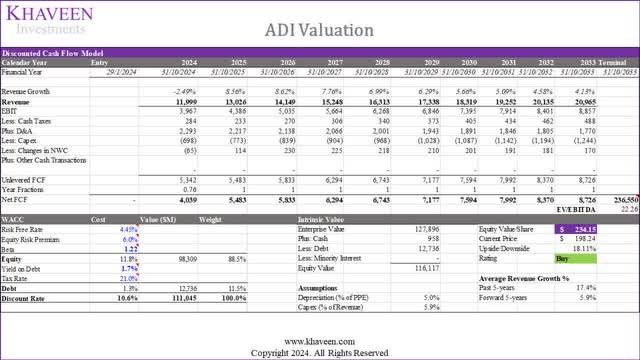
Based on a discount rate of 10.6% (company’s WACC) and terminal value based on an EV/EBITDA of the US-only chipmaker industry’s 5-year average (22.26x), our model shows its shares have an upside of 18.11%.
In summary, we have examined ADI’s slowdown in 2023, which was mainly due to China’s negative growth and inventory issues due in the automotive market and slowing industrial production activity which we anticipate improving throughout 2024 as the PC market recovers to positive growth, automotive chip inventories to stabilize and industrial production is expected to pick up in H2 2024.
We believe the key to the company’s return to positive growth depends on its key segments’ growth, including the company’s Automotive and Industrial segments. We believe the company is well-positioned to capitalize on growth drivers such as EVs, vehicle connectivity, renewables, factory automation, and A&D. Despite our negative growth forecast in 2024, we forecasted the company to recover going forward with an 8.6% growth in 2025. Overall, we maintain a Buy rating for the company with an upside of 18% with a slightly higher price target of $234.15 vs $229.12 previously due to a slightly higher Ev/EBITDA multiple used based on the industry average, despite a lower forecast growth rate taking into account the growth slowdown in 2024 (5-year forward of 5.9% vs 8.4%) previously.
Credit: Source link