
JLGutierrez
This post includes important updates on the M2 money supply, inflation, and key economic indicators.
The all-important M2 money supply continues to come back into line with long-term trends, key inflation measures are very close to the Fed’s target, and money demand is returning to pre-Covid levels.
The service sector (dominated by housing-related costs) is the only area of the economy suffering from above-average inflation at this time, but this should gradually subside over the next 6-9 months. Memo to Fed: You can start reducing short-term interest rates anytime, and the sooner, the better.
Surveys of purchasing managers and capital goods orders suggest the economy is on an unremarkable (~2%) growth path.
Fiscal policy is dominated by an excess of spending and a sharply worsening debt financing problem. While deficit-financed spending may have helped the economy in recent quarters, too much spending can only act as a productivity-sapping headwind to growth in coming years.
Chart #1
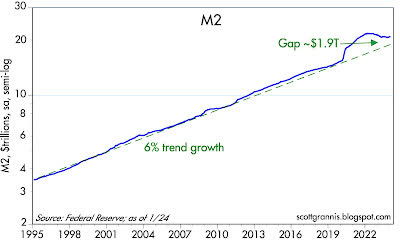
Chart #1 compares the level of the M2 money supply to its post-1995 trend line. $6 trillion of deficit spending was monetized in 2020-21, pushing M2 sharply higher and eventually causing a sizable surplus of money.
Too much money then drove inflation higher. This has largely reversed over the past two years, thanks to the restrictive Fed policy which has kept short-term interest rates high.
Chart #2
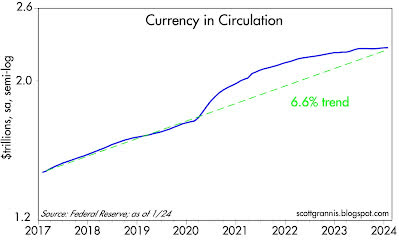
Chart #2 compares the level of currency in circulation to its post-1995 trend line. Currency is a key measure of the money supply because it is the only direct measure of money demand; people hold currency only if they want to.
Unwanted currency can be returned to banks in exchange for deposits and ultimately be absorbed by the Fed.
The 2020-21 pickup in currency growth confirms my view that rising money demand initially neutralized the monetization of $6 trillion of Covid stimulus spending, but that was followed by declining money demand, which fueled rising inflation as people sought to reduce their money balances.
Chart #3
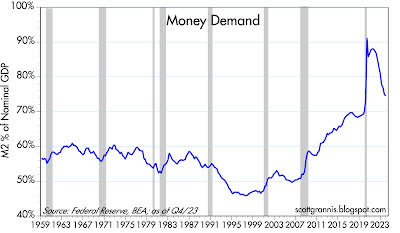
For many years, I have called Chart #3 the most important chart of monetary conditions that hardly anyone looks at. It measures what I call “money demand.”
It is calculated by dividing the M2 money supply by the level of nominal GDP. Conceptually, this is similar to calculating how much of one’s annual income is held in cash and cash equivalents.
For many years (1959-1987), this ratio was remarkably stable, but since then it has become quite volatile.
It is now closing in on pre-Covid levels, which likely presages a return to stable money demand – and by extension, in the context of very slow M2 growth – low and stable inflation.
Chart #4
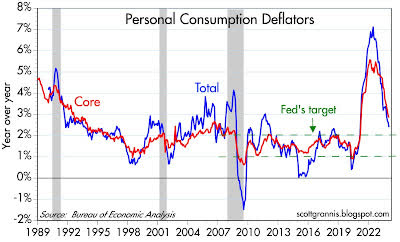
Chart #4 shows the year-over-year change in the Core and Total version of the PCE deflators. By these measures, inflation is within inches of returning to the Fed’s target level.
Chart #5
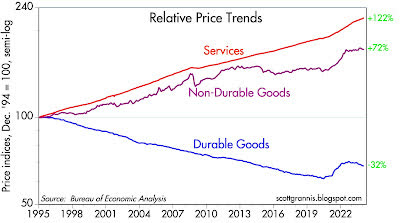
Chart #5 shows the three major categories of PCE prices: services, durable goods, and non-durable goods. Note that the latter two have exhibited essentially no increase for the past two years!
The inflation that shows up in the PCE deflator (Chart #4) comes exclusively from the service sector, and that sector in turn is dominated by calculations of the cost of “shelter.”
As I and others have been pointing out for the past year or so, these calculations are highly correlated to housing prices 18 months in the past.
If they instead were correlated to changes in housing prices over the past 6-9 months, service sector inflation today would be approaching zero.
Chart #6
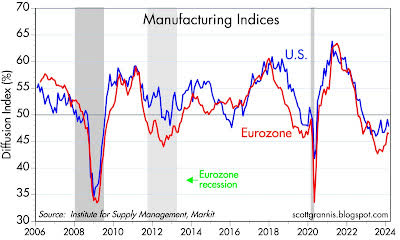
Chart #7
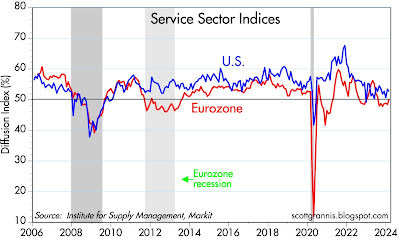
Charts #6 and #7 show survey results from purchasing managers in the US and Eurozone. Based on these surveys, it is clear that the manufacturing sector is suffering from very weak growth conditions.
The much larger service sector, on the other hand, appears to be experiencing average growth conditions, at best.
Chart #8
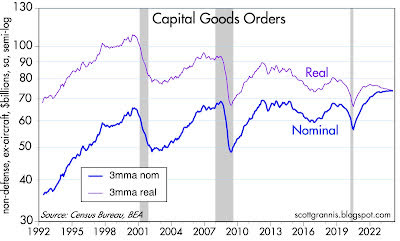
Chart #8 shows the nominal and real (inflation-adjusted) level of capital goods orders.
Capex spending is a good proxy for business investment in new plant and equipment, which in turn provides the seed corn for future productivity gains.
Stagnant capex spending in recent years suggests meager productivity growth in coming years, and only modest overall economic growth.
Chart #9
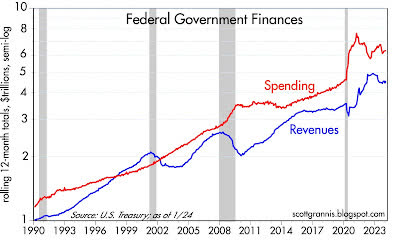
Chart #9 shows the level of federal government spending and revenues (calculated using a 12-month rolling total of each). Note the y-axis is logarithmic, which means that straight lines reflect constant rates of growth.
How many are aware that federal spending has grown almost six-fold since 1990?
Chart #10
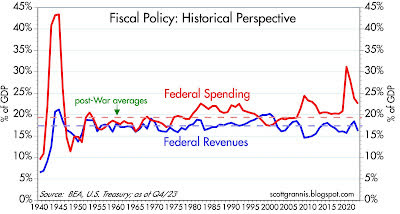
Chart #10 puts federal spending and revenues into an appropriate context, by comparing them to nominal GDP.
Here we see that the growth of spending and revenues has largely tracked the growth of nominal GDP.
Spending today is significantly higher than its post-war average, while revenues are only marginally lower. Spending is what’s driving deficits, not a lack of revenues.
Chart #11

Federal debt owed to the public has now reached $27.4 trillion, or about 95% of nominal GDP. That’s very high from a historical perspective, but the true burden of the debt is how much it costs to finance, which is shown in Chart #11.
It won’t be long until interest costs swell to a record level relative to GDP, even if the Fed starts to lower short-term interest rates as the market expects.
Important point that most people are unaware of:
Our mountain of federal debt is the source of much gnashing of teeth and cries of impending doom. What’s missing from all the shouting is this: making payments on a gargantuan amount of debt does not equate to flushing money down the toilet.
Interest paid on federal debt is a burden to taxpayers, to be sure, but it is a source of income to those holding the debt. It’s a zero-sum game: no money is destroyed in the process, it simply changes hands.
What is important, however, is this: when the debt is the result of excessive government spending, this means that the economy is squandering its resources.
Why? Because government spending is almost always less efficient and less productive than if the private sector were spending the same amount of money.
To paraphrase Milton Friedman: debt is not the problem; spending is the problem.
Original Post
Editor’s Note: The summary bullets for this article were chosen by Seeking Alpha editors.
Credit: Source link