
cemagraphics
Last weekend’s article detailed a “Window for a Reversal” for the S&P500 (SPY) after it tested the 5107-12 target. It’s tempting to get carried away when a market stops exactly where you thought it would and drops 50 points, but there were two key things needed to confirm a reversal – a break of 5030-38, plus a Friday close near the lows of the weekly range – and neither played out.
Personally, I’d much rather we saw a correction develop as I am underinvested and my trading style suits a higher volatility environment. However, that doesn’t mean I fight the trend each week – it’s exhausting and usually expensive. Identifying key levels and price action to monitor means I can either buy against those levels, flip bearish if they break, or like last week, do nothing.
This weekend’s article will look at the prospects for March and the implications of the weekly Demark exhaustion signal. Various techniques will be applied to multiple timeframes in a top-down process which also considers the major market drivers. The aim is to provide an actionable guide with directional bias, important levels, and expectations for future price action.
S&P 500 Monthly
The February bar closed near the highs of the monthly range at 5096 and we have already seen the expected continuation in the first session of March.
Now that new highs have been made this month, a bearish bar can form quite easily with a drop back into the February range below 5111. Saying that, it would need to close below this level and ideally much lower, which is obviously some time away.
As well as the monthly chart, I keep an eye on the quarterly chart which is shaping up in a very bullish way. Q4 was a huge bar and closed at 4793 to set up the break to new all-time highs in Q1. The Q1 bar took its opportunity and likely closes strong (which obviously would mean March also closes strong).
SPX Monthly (Tradingview)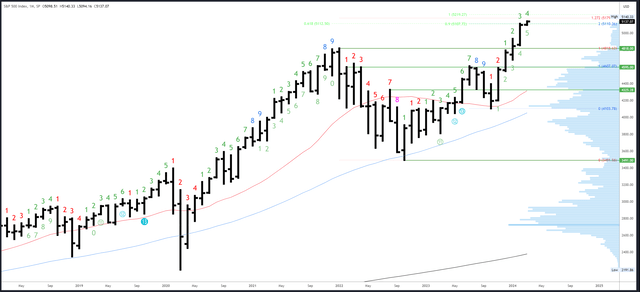
The Fib cluster in the 5107-112 range caused a small reaction. 5179 is the next Fibonacci extension (127% extension of the 2021-2022 drop). The next measured move is 5219 where the current rally from the October ’23 low will be equal to the October ’22 – July ’23 rally.
5096-5111 will be important towards the end of March, but not so much next week. 4818 is the first major level at the previous all-time high.
There will be a long wait for the next monthly Demark signal. March is bar 4 (of a possible 9) in a new upside exhaustion count.
S&P 500 Weekly
Yet another bullish weekly bar formed this week with a higher low, higher high and higher close. Seven of the eight bars in the rally off the January low have had the same characteristics.
The weekly channel high has now been broken more convincingly. I actually don’t put too much importance on this – breaking out from a downtrend channel is way more important – it simply means there is no longer potential resistance.
SPX Weekly (Tradingview)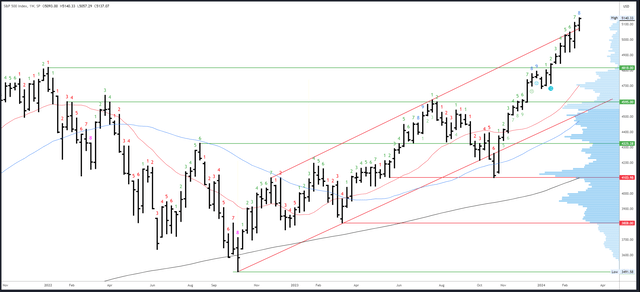
The areas to watch on the downside remain the same as last week. 5030-48 is key to momentum. Below there, the 4918-20 double bottom is the next important zone.
An upside Demark exhaustion count will be on bar 9 (of 9) next week. A reaction is usually seen on weeks 8 or 9 and the new highs this week should help the exhaustion signal play out. Warning – the last complete signal led to a drop lasting just one week!
S&P 500 Daily
Thursday’s big volume and Friday’s break out and strong close are notable. There are high odds for continuation early next week and 5105-111 should hold dips initially.
SPX Daily (Tradingview)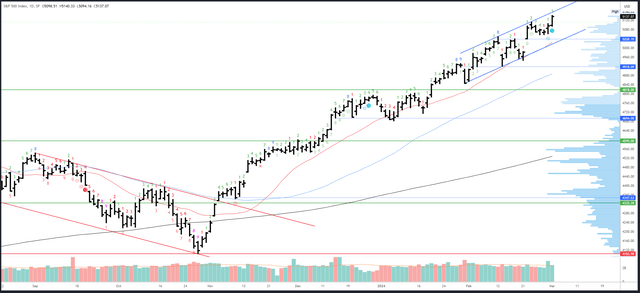
The only resistance comes from the new channel high which will be around 5160 on Monday.
The first support is 5105-111. Channel support is very near the 20dma. Both will rise from the 5020s to the 5050s by the end of next week.
A daily Demark exhaustion cannot complete next week, although a sequential 9-13 did complete on Friday. I find these provide mixed results, but it could be more reliable in conjunction with the weekly exhaustion.
Drivers/Events
Prelim GDP came in at a very decent 3.2% q/q this week and the Core PCE Price Index m/m posted 0.4%. Both the economy and inflation are heating up which is apparently just fine for stock markets at the moment despite rate cuts being pushed back.
Perhaps the data would matter more if the Fed shifted back hawkish. So far there is no sign of this, but I am again reminded of last year when re-acceleration in the economy prompted a flurry of hikes when the market thought a pause was coming. I think a repeat is unlikely to happen in 2024, but we might see a more hawkish message this week from Fed Chair Powell in his two day testimony on Monetary Policy. Will there be a point when the Fed considers more tightening? By saying nothing they are allowing stocks to balloon higher whether the data is good (cuts aren’t needed) or bad (cuts will solve everything).
Powell’s testimony takes place on Wednesday and Thursday.
Friday’s main release is the jobs report which could continue to show a very tight labor market. Whether this is positive or negative for the market will depend on what Powell says on data, if anything.
Probable Moves Next Week(s)
The strong action at the end of last week projects continuation on Monday/Tuesday. 5105-111 should hold any initial dips to target the Fibonacci extension at 5179. Powell’s testimony will likely cause some volatility, but unless he signals the Fed is ready to tighten again (or at least keep rates higher for longer) in response to data, any reaction could be inconsequential.
As always, there is the potential for a reversal. Some weeks and set-ups have better odds than others, and as next week will register weekly exhaustion, the probabilities are slightly higher. However, unless certain things happen, there is no point fighting the trend.
The daily channel and 20dma are the first areas of good support. Breaking these would be a red flag but only a weak Thursday/Friday and a weekly close near 5030-38 would signal real danger for the uptrend.
Credit: Source link