CHUNYIP WONG
February 28th ended up being a really fantastic day for shareholders of Chart Industries, Inc. (NYSE:GTLS). Shares of the company shot up, closing higher by 12.3%, after management announced financial results covering the final quarter of the 2023 fiscal year. Although revenue and earnings fell short of expectations, adjusted earnings comfortably beat forecasts. Backlog was driven higher by robust orders and guidance for the 2024 fiscal year came in strong.
If this is any indication of how Chart Industries, Inc. should be moving forward, shares look very attractive on a forward basis. And even as they stand today, they don’t look terribly pricey compared to similar firms. Given these factors, I would say that the company makes for a decent “buy” candidate at this time.
A great quarter
Many investors are likely unaware of Chart Industries and what the company does. According to the management team of the firm, the company operates as a designer, engineer, and manufacturer of process technologies and equipment for gas and liquid molecule handling. The company has successfully branded itself over the years as a player on all things “clean,” with examples being clean power, clean water, clean food, and more. Unfortunately, this doesn’t tell us terribly much about the specific products and services that the company offers. So naturally, we have to dig a bit deeper. And the best way to do this is to look at each of its operating segments.
At the top of the list, we have the Cryo Tank Solutions segment. In 2023, this accounted for roughly 19% of the firm’s revenue. According to management, this unit produces and sells cryogenic solutions that help with the storage and delivery of cryogenic liquids that can be used in industrial gas and liquefied natural gas applications. On the industrial gas application side of the equation, the end use is ultimately equipment used for the healthcare industry, or for electrical components, welding, and more. For liquefied natural gas, the company’s products include things like bulk storage tanks, cryogenic trailers, regasification equipment that is configured for delivering liquefied natural gas, and more.
Next in line is the Heat Transfer Systems segment. This accounted for 26.4% of the firm’s revenue last year. This unit produces engineered equipment and process systems that can be used in the separation, liquefaction, purification, and more, of hydrocarbons and industrial gases. Examples here would include natural gas processing, liquefied natural gas technologies such as pressure vessels, heat exchangers, pipe work, and more. The company also produces air cooled heat exchangers and cooling fans that are used in HVAC, power, and refining applications.
The third segment is known as Specialty Products. This unit, which accounted for 24.2% of revenue last year, produces mobility and transportation equipment that can be used with both hydrogen and liquefied natural gas, examples being on board vehicle tanks and fueling stations. The company also produces nitrogen dosing products and other equipment that can be used in the packaging of food and beverage products, not to mention other things. It’s water treatment technology Focuses on a wide variety of applications such as filtration, facilitating reverse osmosis, and more.
Lastly, there is the Repair, Service & Leasing segment. This was the largest of the firm’s units last year, accounting for 30.4% of sales. And as its name suggests, it focuses on things like installation services, equipment servicing, repairs, maintenance activities, and even refurbishment of the products it sold to customers previously.
Author – SEC EDGAR Data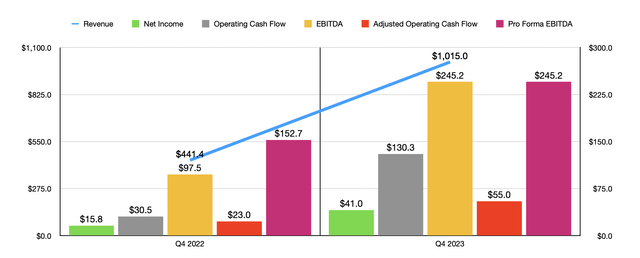
Before the market opened on February 28th, the management team at Chart Industries announced financial results covering the final quarter of the 2023 fiscal year. Revenue for that time came in at just under $1.02 billion. That represents a significant increase over the $441.4 million generated one year earlier.
All of the companies operating segments increased during this window of time. But the two largest movers were the Specialty Products segment and the Repair, Service & Leasing segment. The first of these saw revenue jump by 84.8% from $117.4 million to $217 million. And the second of these saw revenues skyrocket from only $55.2 million to $340.7 million.
Unfortunately, management has not disclosed exactly how much of this growth was driven by organic means and how much was driven by acquisition activities. But it is very safe to say that most of the increase during this window of time was driven by the firm’s purchase of Howden, which the company ultimately ended up paying $4.32 billion for after netting out cash and cash equivalents.
As strong as revenue growth was, it actually fell short of analysts’ expectations by roughly $80 million. The same thing happened on the company’s bottom line as well. The firm went from profits per share of $0.37 to $0.88. Unfortunately, that was still $0.97 per share lower than what had been forecasted. The good news is that adjusted profits per share of $2.25 beat forecasts by $0.11. So not everything was bad relative to what analysts were hoping for. In the first chart in this article, you can see not only net profits, but also operating cash flow, adjusted operating cash flow, and EBITDA.
Author – SEC EDGAR Data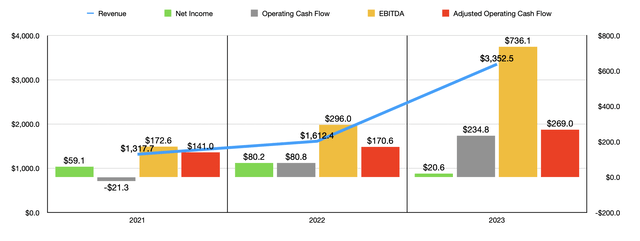
What has been largely acquisition-based growth has allowed the company to expand over the past few years from sales of $1.31 billion in 2021 to $3.35 billion last year. Net profits have been all over the map. But if you look at the cash flow data for the company, there has been a pretty consistent uptrend. The great thing is that management expects this to continue.
Chart Industries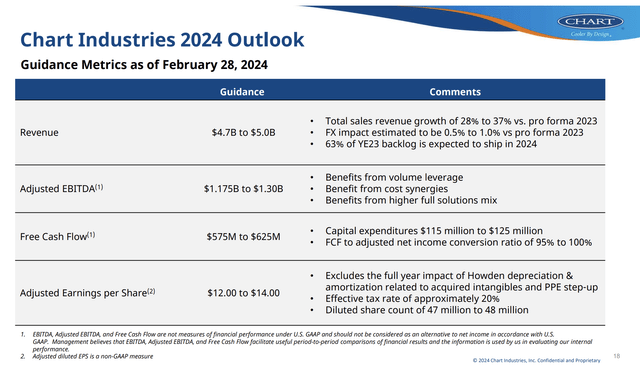
Chart Industries Chart Industries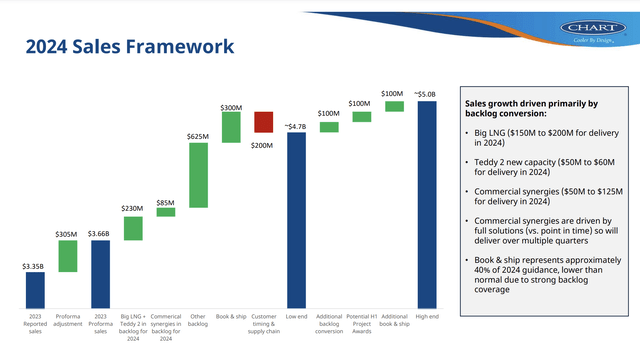
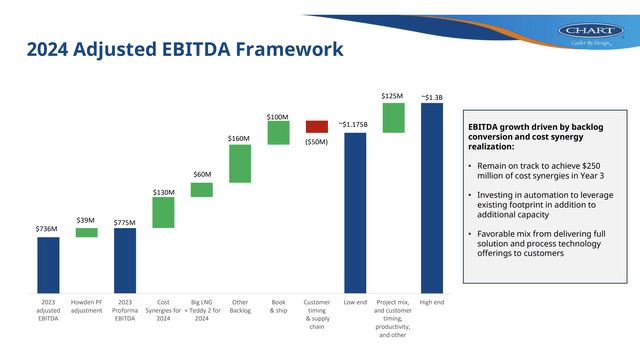
For 2024, revenue is expected to come in at between $4.7 billion and $5 billion. At the midpoint, that would imply an increase over what the company saw for 2023 of 44.7%. Profitability is also expected to improve drastically. Earnings per share should be between $12 and $14, which would translate, at the midpoint, to $617.5 million. Operating cash flow has been forecasted to be between $690 million and $750 million, while EBITDA should come in at between $1.175 billion and $1.30 billion.
Author – SEC EDGAR Data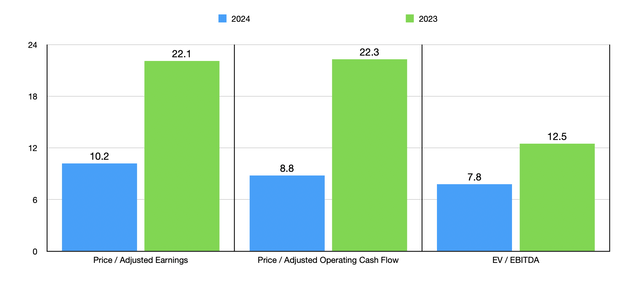
This overall increase can be attributed in large part to the rise in backlog that the company has experienced up to this point. At the end of 2022, the firm had only $2.34 billion in backlog, though on a pro forma basis it was $3.45 billion. By the end of the final quarter of this past year, it had grown to $4.28 billion. In the final quarter alone, the company reported $1.21 billion of new orders. That dwarfs the $525.9 million reported the same time one year earlier.
Using these figures, I was then able to value the company as shown in the chart above. As you can see, the stock goes from being perhaps a bit pricey using 2023 figures to being very attractive using 2024 estimates.
I then, in the table below, compared it to five similar firms. Even using the data from 2023, the stock does not look unreasonably priced. On both a price to earnings basis and on an EV to EBITDA basis, two of the five companies ended up being cheaper than it. This number does increase to four of the five when looking at the picture through the lens of the price to operating cash flow multiple.
| Company | Price / Earnings | Price / Operating Cash Flow | EV / EBITDA |
| Chart Industries | 22.1 | 22.3 | 12.5 |
| Flowserve (FLS) | 30.1 | 17.2 | 16.9 |
| ESAB Corporation (ESAB) | 27.5 | 19.8 | 14.4 |
| SPX Technologies (SPXC) | 60.9 | 26.0 | 20.5 |
| Mueller Industries (MLI) | 9.6 | 8.6 | 5.2 |
| The Timken Company (TKR) | 15.4 | 11.1 | 9.4 |
As I mentioned earlier in this article, a lot of the growth that Chart Industries experienced in 2023 was driven by acquisition-based activities. However, management still believes that, between now and the end of 2026, the company can still achieve organic revenue growth that is in the mid-teens rate.
For such a large business, this might seem like a very high growth rate. However, management has identified a rather large commercial opportunity pipeline estimated at around $21 billion. Over $1.6 billion of that falls under the synergy order pipeline. A good chunk of the $21 billion figure involves what management calls Big LNG, which management estimates to come out at 30 different projects. The overall opportunity here is estimated to be worth around $8.6 billion. Other LNG opportunities the management 461 in all.
On top of this, other end market opportunities exist when it comes to hydrogen, carbon capture, and water treatment. And if the past is any indication of the future, there will be even more such projects across the board a year out from now.
Chart Industries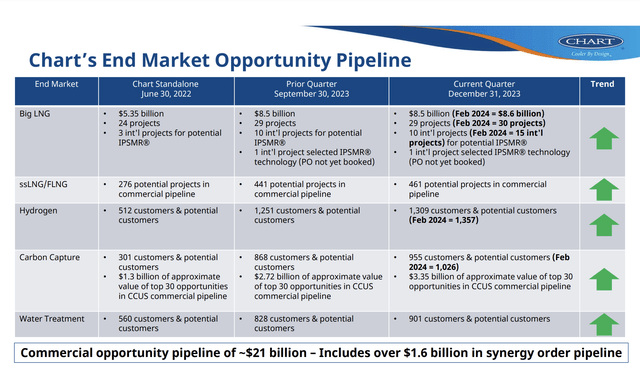
In general, this projected revenue growth will help adjusted earnings per share growth to come in at the mid 40% range on an annualized basis. If this seems insane, it’s important to note that the firm’s acquisition activities have opened the door for some significant cost savings initiatives. For instance, the goal for the company had been to achieve $175 million of cost savings associated with its purchase of Howden within the first year that the deal was completed. However, management exceeded this with savings of $181.4 million. Even more impressive is the target when it comes to commercial synergies. The company had hoped to achieve $150 million of this within one year of the closing of the transaction and $350 million after three years. However, the amount achieved so far is $529.9 million. With progress like that in such a short window of time, the sky seems to be the limit to me.
Chart Industries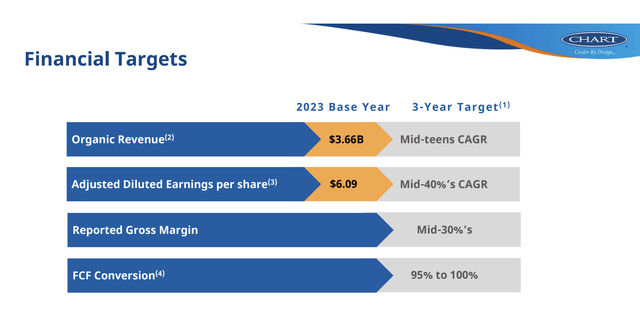
Takeaway
Investors who decide to place their money into Chart Industries are likely doing it with the hope that management can achieve some rather impressive growth and bottom line improvements in the foreseeable future.
Obviously, nothing is guaranteed. But Chart Industries, Inc. has demonstrated just how quality its operations are. Even if improvements are not realized, the stock does not look outrageously priced. And on a forward basis, it is very attractive. This is in spite of the fact that the firm had a rather difficult quarter compared to what analysts were hoping for. But clearly, the positive outweighed the negative. Given these developments, I would argue that Chart Industries makes for a decent ‘buy’ prospect at this time.
Credit: Source link


