
mikkelwilliam
Thesis
Super Micro Computer (NASDAQ:SMCI) has had a glorious run since the start of its FY23 in July 2022 as it has delivered a total shareholder return of almost, 2050% since then:
SMCI Performance since start of FY23 (TradingView, Hunting Alpha Analysis)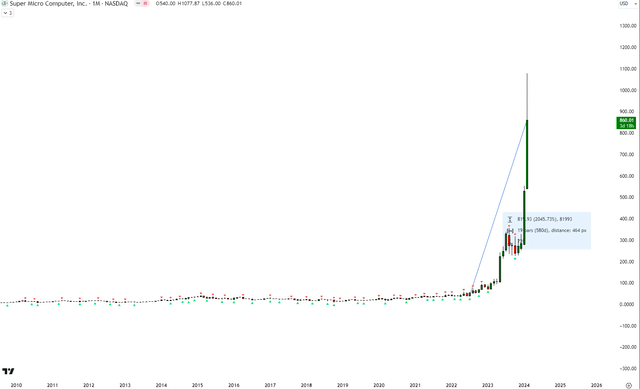
However, I believe it is now due for a time correction/period of ranging action:
- The fundamental growth engine remains strong
- Valuations provide little margin of safety
- Technicals flash signs of a local top
The fundamental growth engine remains strong
As mentioned in my recent article on NVIDIA (NVDA), I believe it is important to focus on leading revenue growth indicators as opposed to revenue alone. Looking at the remaining performance obligation (RPO) numbers gives us a concrete idea of the backlog size:
RPO YoY (Company Filings, Hunting Alpha Analysis)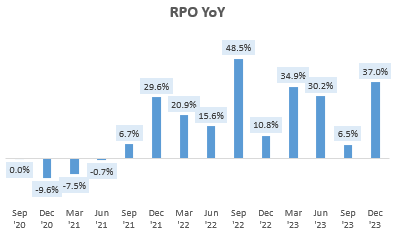
SMCI’s YoY RPO growth remains very healthy, at >30% on average over the last few quarters. Moreover, the net new YoY RPO matched all-time highs in Q2 FY24:
RPO Net New YoY (Company Filings, Hunting Alpha Analysis)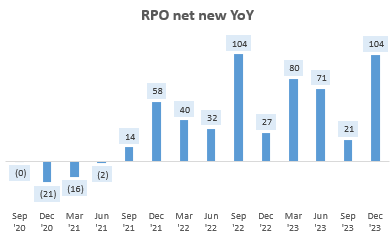
Some readers have asked me where the RPO numbers are usually disclosed. It is found in the 10-Q and 10-K releases. I suggest doing a Ctrl+F for the “remaining performance obligation” key term.
Management’s commentary is bullish as well:
rack-scale plug and play IT and AI total solution continues to gain more new customers
– CEO Charles Liang in the Q2 FY24 earnings call, Hunting Alpha’s highlight
Next-generation AI and CPU platforms continue to drive strong levels of design wins…. [with] Orders and backlog from top-tier data centers, emerging cloud service providers enterprise channel and Edge IoT, telco customers
– CFO David Weigand, Hunting Alpha’s highlight
I view management’s commentary and the market’s perception of that as reliable, as the company has a good track record of meeting or slightly beating revenue expectations, with an average beat of 2.3% over the past 18 quarters:
Revenue Surprise vs Consensus (Capital IQ, Hunting Alpha Analysis)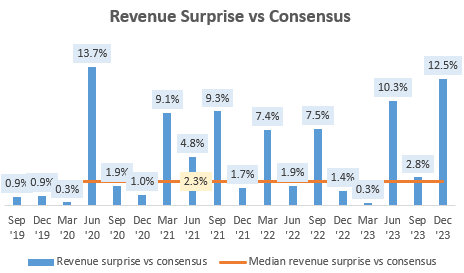
I view this as a clear sign that there is still healthy (>30% YoY) revenue growth ahead over the next few quarters:
Total Revenue YoY (Company Filings, Hunting Alpha Analysis)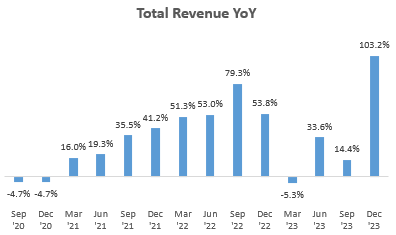
Last week’s consensus-beating and, more importantly, guidance beating ($24 billion vs. $21.9 billion expected for FY25 revenues) results by NVIDIA have fueled further optimism for SMCI. However, I believe this has led to a situation wherein:
Valuations provide little margin of safety
Before getting into SMCI’s valuation, I want to reflect a bit on my assessment of NVIDIA as I missed marking that as a ‘buy’ before earnings, even when the stock was trading near 5-yr trough valuations:
NVIDIA Valuation before Q4 FY24 Earnings Release (Capital IQ, Hunting Alpha Analysis)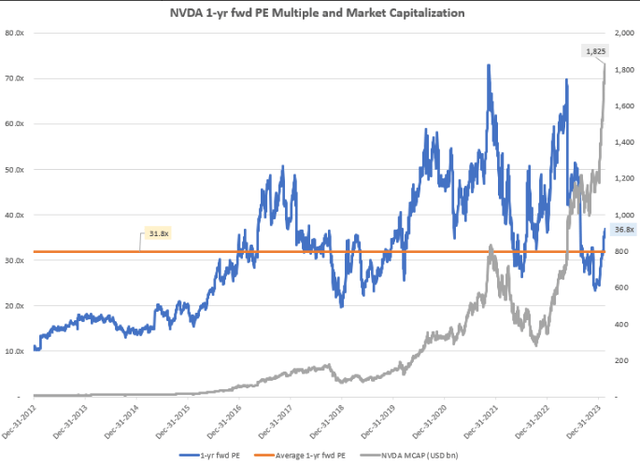
A point of reflection for me is that the valuation discount was probably sufficient to warrant buys. Demanding for a discount in the market capitalization may have been asking for too much.
However, I do not see a similar valuation discount setup in SMCI. On the contrary, at 32.01x, SMCI’s 1-yr fwd PE valuation is above historical peak levels of around 25.00x:
SMCI 1-yr fwd PE (Capital IQ, Hunting Alpha Analysis)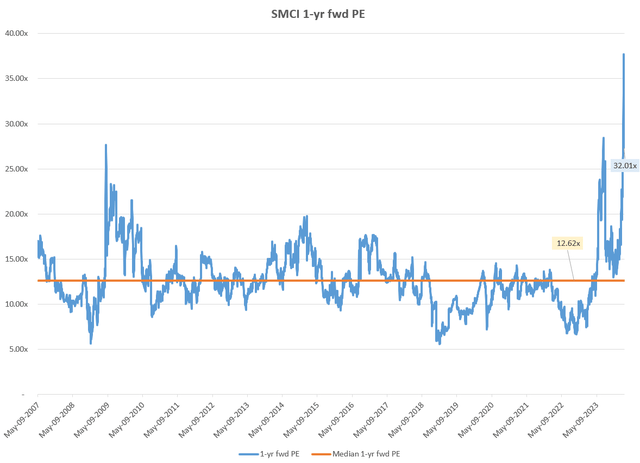
Hence, my assessment here is that SMCI’s valuations provide a low margin of safety for fresh buys.
Technicals flash signs of a local top
If this is your first time reading a Hunting Alpha article using Technical Analysis, you may want to read this post, which explains how and why I read the charts the way I do.
SMCI Relative Technical Analysis (TradingView, Hunting Alpha Analysis)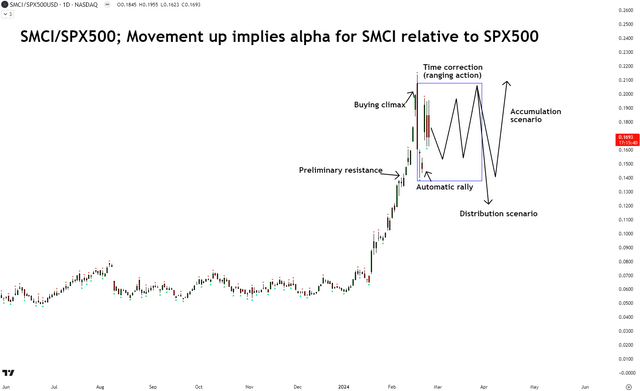
My charts always reflect total shareholder return movements
In the relative daily chart of SMCI vs. S&P 500 (SPY) (SPX), I recognize a potential Wyckoff distribution structure developing as I spot a preliminary resistance/supply, buying climax and an automatic rally/reaction. I believe the ratio prices are due to range for a while before resolving in either a confirmed distribution scenario via a break to the downside or a re-accumulation scenario with a break to the upside. It is too early for me to have a confident view of either of those 2 scenarios. However, the commonality in both cases I see is a period of time correction via a range or consolidation. This would correspond with SMCI performing mostly in line with the broader S&P 500.
Key Risks and Monitorables
In addition to tracking the health of the leading revenue metrics via industry commentary and data-center customers’ commentary (such as Google (GOOG), Microsoft (MSFT), Amazon (AMZN) and Meta (META)), I am also keeping an eye on SMCI’s gross profit margins:
Gross Profit Margins (Company Filings, Hunting Alpha Analysis)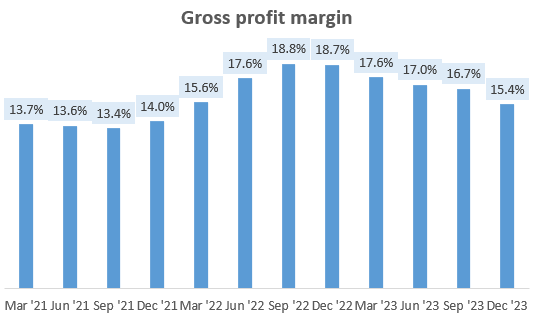
SMCI’s gross profit margins have been down-ticking in recent quarters. Management says this is due to their prioritization of gaining market share and indicated further declines in Q3 FY24:
We expect gross margins to be slightly lower than Q2 levels
– CFO David Weigand in the Q2 FY24 earnings call
When asked about a potential gross margin floor, management referred to an old target of 14-17% they had disclosed in March 2021, but qualified that they are open to making any changes if required:
So although we said 14% to 17% at that range in 2021, but if any change in there for adjustment will be the best for shareholders, we will do that change.
– CEO Charles Liang in the Q2 FY24 earnings call
I suspect that the Street would not view a revision downward too favorably, and hence I think there may be some downside surprise risk on this metric here.
Takeaway
Like NVIDIA, the RPO numbers (a proxy for revenue backlog) and commentary suggest that the growth momentum for SMCI continues to be strong. However, unlike NVIDIA before their earnings, SMCI’s valuations today are near historical peak levels as opposed to historical trough levels. I believe this reduces the margin of safety available for buys. Moreover, I believe the technicals on the relative chart of SMCI vs. the S&P 500 point toward a local top according to Wyckoff Phase Theory. Hence, I believe we are due for a time-correction/ranging action ahead.
Hence, I rate the stock a ‘Neutral/Hold’.
How to interpret Hunting Alpha’s ratings:
Strong Buy: Expect the company to outperform the S&P 500 on a total shareholder return basis, with higher than usual confidence
Buy: Expect the company to outperform the S&P 500 on a total shareholder return basis
Neutral/hold: Expect the company to perform in line with the S&P 500 on a total shareholder return basis
Sell: Expect the company to underperform the S&P 500 on a total shareholder return basis
Strong Sell: Expect the company to underperform the S&P 500 on a total shareholder return basis, with higher than usual confidence
The typical time-horizon for my views is multiple quarters to around a year. It is not set in stone. However, I will share updates on my changes in stance in a pinned comment to this article and may also publish a new article discussing the reasons for the change in view.
Credit: Source link